Filtering
Use Filtering to define which respondents are included in a crosstab or table.
In OfficeReports, the default report output is filtered by the active:
- Report Filter
- AND Segment1
- AND Segment2
- AND Segment3
for every segment filter that is defined.
You can then further control the result in two ways:
- add filtering for a whole table
- define filtering for one specific category or column inside a table
In addition, table-level and category-level settings can ignore one or more active higher-level filters.
Report Filters and Segment Filters
Use Report Filters to define the default filtering for the report.
- Click Report Filters on the OfficeReports Ribbon Tab.
- Define the Report Filter, and the filters Segment1, Segment2 and Segment3.
These filters define the default report output.
For example, if you set:
- Report Filter =
2024 - Segment1 =
Finance - Segment2 =
BKP
then the report shows respondents that match:
2024 AND Finance AND BKP
If a segment filter is not defined, it is not part of the filter logic.
Segment Filters and batch generation
Segment Filters are ordinary report-level filters, but they also have an extra use in batch generation.
When you use Batch Reports or Batch Reports for PowerPoint, OfficeReports can generate one report for each selected combination of Segment1, Segment2, and Segment3 categories.
For example, if you select all departments in Segment1 and all teams in Segment2, OfficeReports can generate one report for each department/team combination.
Table-level filtering
Use table-level filtering when you want to apply extra filtering to the whole crosstab or table.
- Open the table settings for the crosstab.
- Set the required filter options for the table.
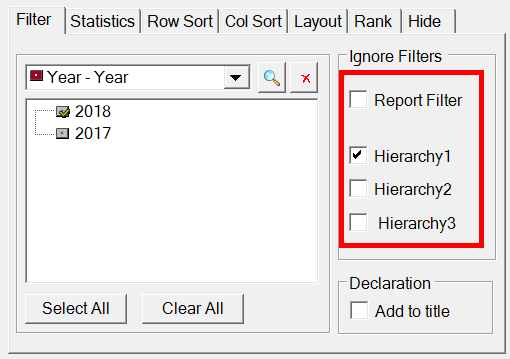
Table-level filtering affects the whole table.
Use table-level filtering when:
- one table should be narrower than the default report output
- one table should use extra filtering logic
- one table should behave differently from the other tables in the report
Category-level filtering
Use category-level filtering when you want filtering to apply only to one category or column in the table.
This does not filter the whole table. It only affects the specific category.
- Open the Variable window.
- Select a category in a derived variable.
- Set the required category filter options.
A category can:
- contain the observations in the active report and hierarchy filters
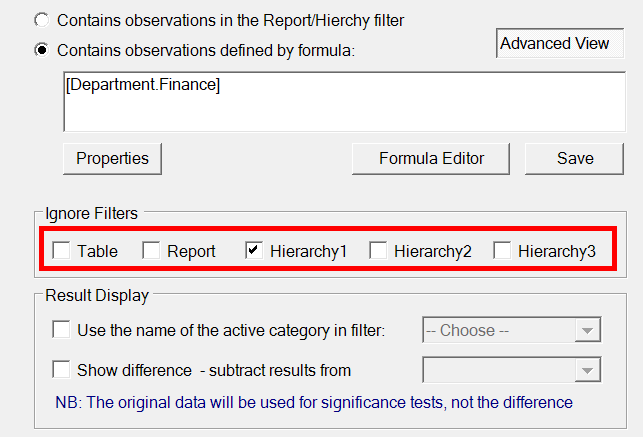
- contain observations defined by a formula
- ignore one or more active filters
For example, the expression [Department.Finance] can be used as a formula for one category.
Use category-level filtering when you want special columns such as:
CompanyDepartmentLast Year- a specific comparison group
to follow different filtering logic from the rest of the table.
Ignore Filters
In many reports, the active Report Filter and Segment Filters define the default output.
OfficeReports can ignore one or more of these filters at lower levels:
- a table can ignore one or more active filters for the whole crosstab
- a category can ignore one or more active filters for that category only
This is important when:
- the report itself should show one department or team
- but one table should show broader results
- or one category such as
Company,Department, orLast Yearshould ignore part of the default filtering
You can also define this automatically through Default Table Settings, so that the ignore-filter settings are applied whenever a specific variable is used in a table.
When should I use which filtering level?
Use Report Filter and Segment Filters when:
- the whole report should be limited to the current wave, period, market, department, team, or segment
- you want the visible report to follow one default filter combination
- you want to generate batch reports for multiple segment combinations
Use table-level filtering when:
- one whole table should behave differently from the rest of the report
- one table should use extra filtering
- one table should ignore one or more active higher-level filters
Use category-level filtering when:
- one category or column inside the table should behave differently
- one category should use a filter formula
- one category should ignore one or more active filters
- you want a column such as
Company,Department, orLast Year
Example: Create a Team Table with Comparison Columns
This example shows how to create reports for each team in every department. The table shows all teams in the active department and includes columns for the whole company, the whole department, and last year. It also shows significance differences compared with the active team.
Set the Report Filters
- Set the Report Filter to category
2020of the variable Year. - Select department
Financeas the Segment1 Filter. - Select team
BKPas the Segment2 Filter. - Use the banner variable you are creating as the Segment2 variable.
- Select team
BKPfrom this banner variable.
Because you want to test significance against the active team, you must use the banner variable you are creating as the Segment2 variable.
Create the Banner Variable
- Copy the Teams variable.
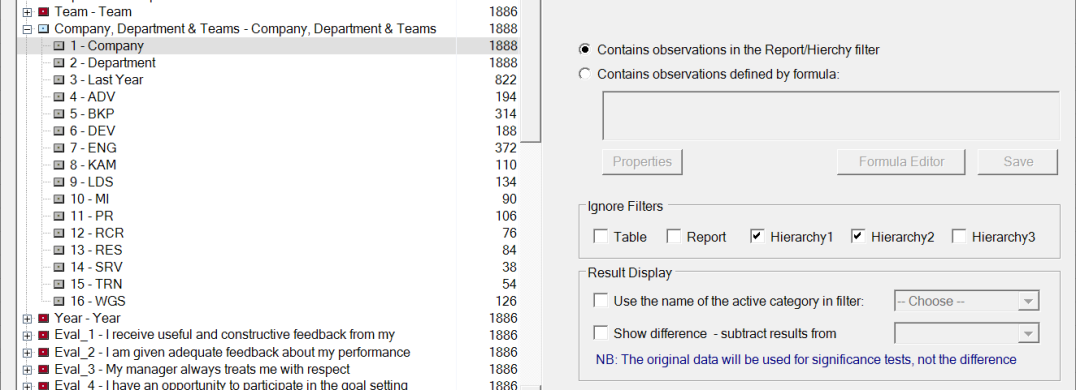
- Add the categories
Company,Department, andLast Year.
To get the numbers for Company, you must ignore the filters for department and team.
To get the results for the complete department, you must ignore the team filter.
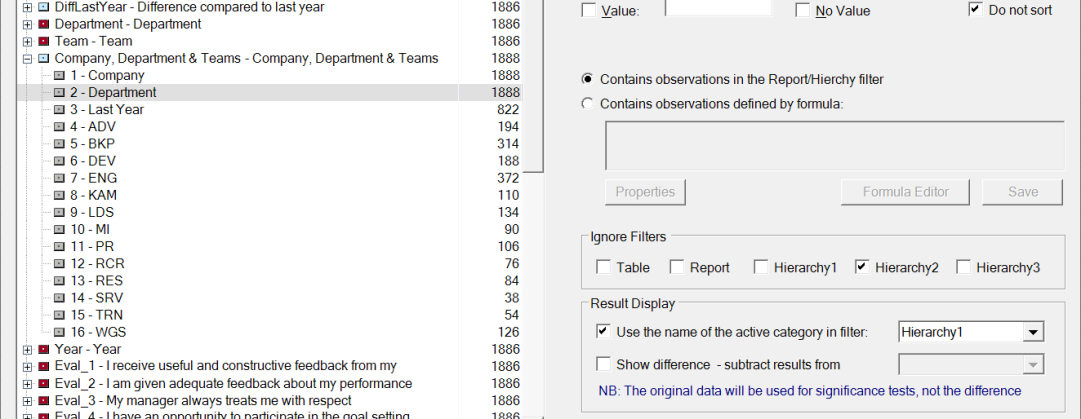
Show the Active Department Name
- Select Use the name of the active category in filter Segment1.
This shows the name of the active department in the table.
Add a Last-Year Column
- Enter
[Year.2019]as the formula for the Last Year category. - Ignore the Report Filter for this category.
If possible, use the Formula Editor to create formulas.
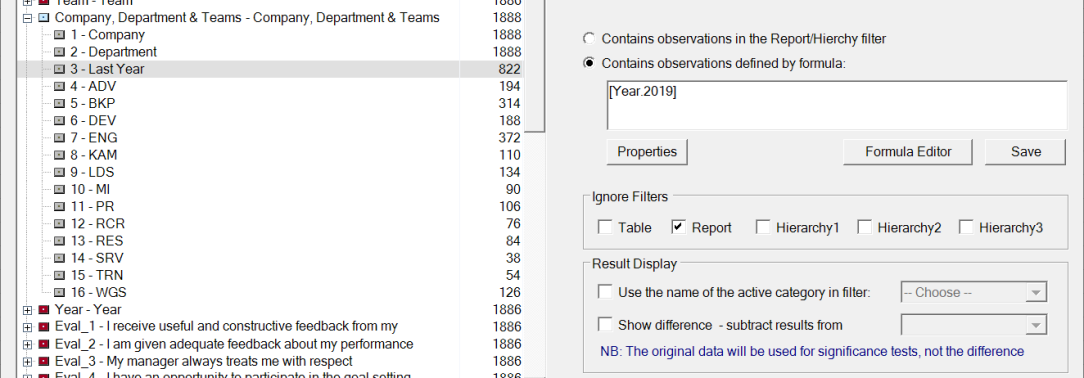
If you also select Ignore Segment2, the column shows last year's results for the department instead of the team.
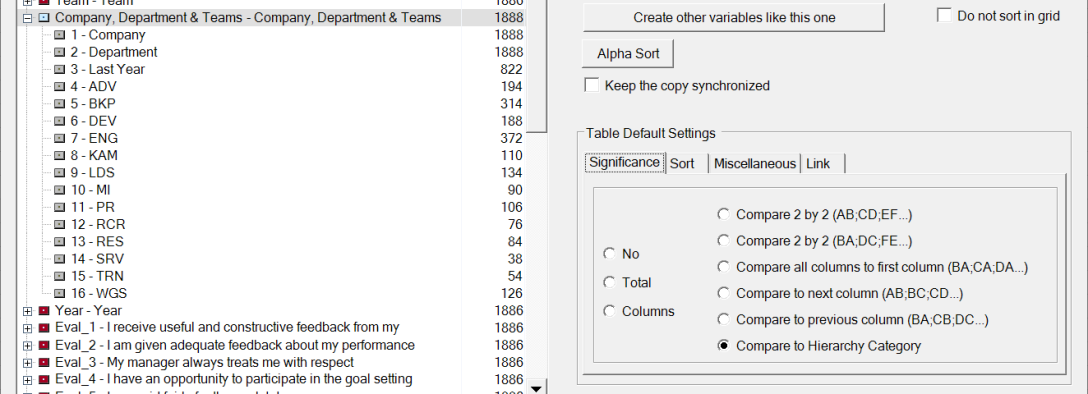
Define Default Table Settings for Significance Testing
You can set significance testing for each table individually, or define it as a default table setting for the variable. If you define it as a default, OfficeReports automatically applies the setting to all tables that use this variable in the banner.
- Select the variable.
- Click Default Table Settings.
- Apply the significance setting shown below.
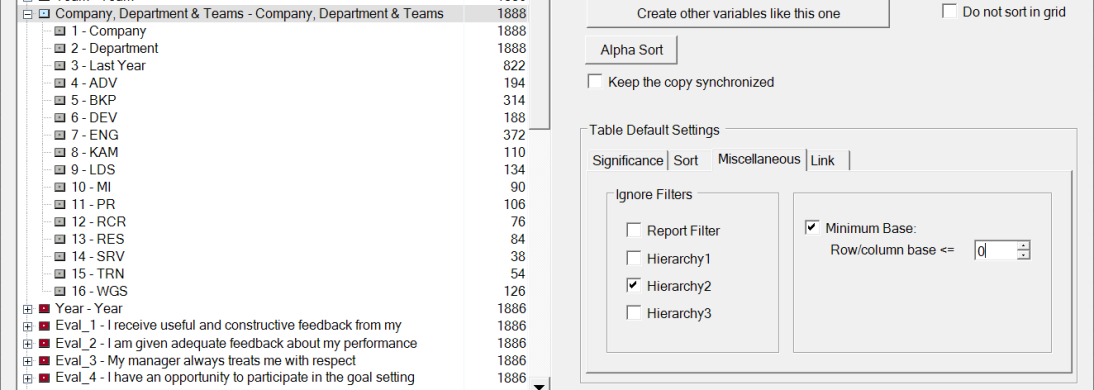
Ignore the Team Filter in Default Table Settings
- Open the Miscellaneous tab.
- Set the table to ignore the team filter.
- Hide empty columns with base 0.
If you do not ignore the team filter, you do not get data for the other teams in the same department. The empty columns are teams that belong to departments other than Finance.
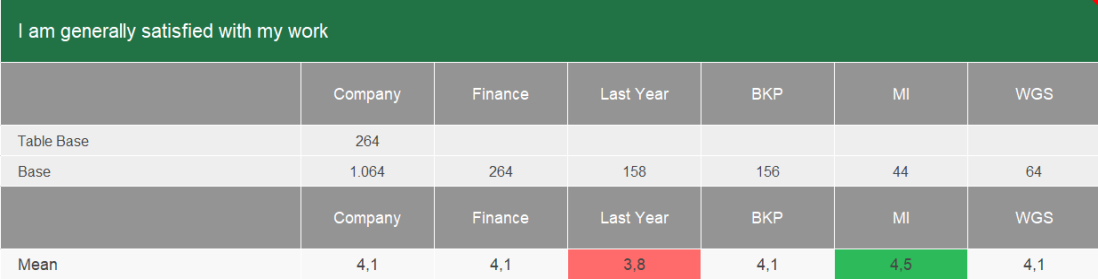
Create the Table
- Select your new variable as the banner variable.
- Select a scale question as the Cell summary variable.
- Create a table that shows the mean.
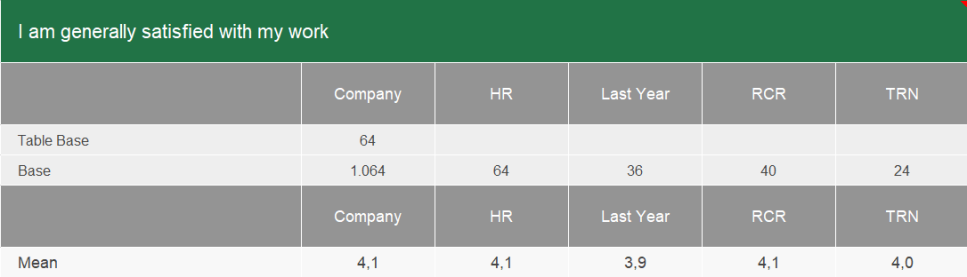
Update the Same Table for Another Department and Team
- Change the Segment Filters to department
HR. - Change the Segment Filters to team
RCR. - Click Apply.
The same table then shows the following content:
Common filtering problems
A table shows fewer respondents than expected
Check whether:
- the Report Filter excludes part of the data
- one or more Segment Filters are active
- the table has its own filter settings
- one or more categories use formulas or ignore-filter settings
A Company or Department column is empty
Check whether that category should ignore one or more active Segment Filters.
A Last Year column is empty
Check whether:
- the category formula is correct
- the category ignores the active Report Filter if needed
The table only shows the active team, not the comparison columns
Check whether the table or the banner variable should ignore the active team filter.
Batch-generated reports are too narrow
Check whether the selected Segment Filters are correct and whether tables or categories unintentionally inherit filters that should be ignored.
Filtering compared with other table settings
Filtering defines which respondents are included.
Filtering does not define:
- the default settings for tables in the report
- the statistical methods used in significance testing
- the settings automatically applied when a specific variable is used in a table
- how the table is formatted or displayed
See also: