Data Visualization
Use data visualization in PowerPoint to link workbook data to shapes, tables, and charts in your presentation.
Attach a Workbook
Before you can work with data visualization, attach a workbook to the presentation.
If you work with raw data, OfficeReports creates and attaches a workbook automatically when you start the OfficeReports app and click New.
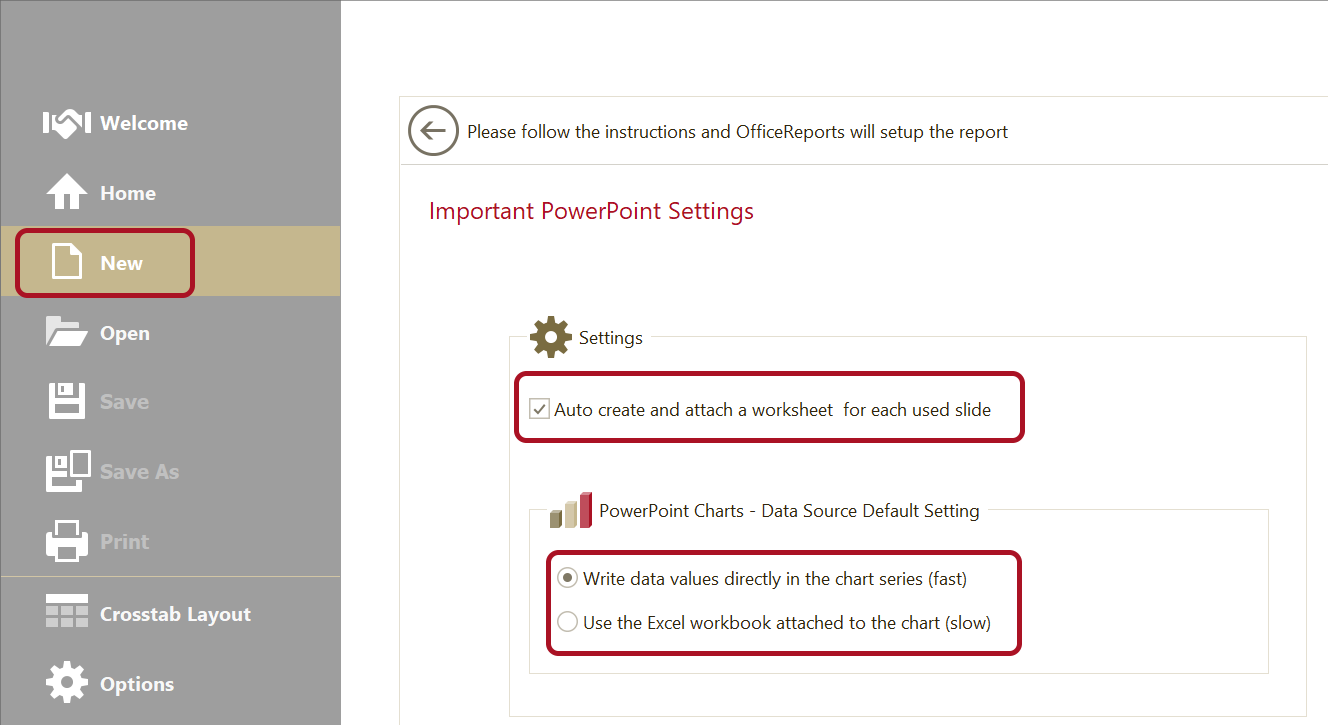
By default, OfficeReports writes data directly into the charts. Change this setting if you want to edit the chart data in the chart workbook.
By default, OfficeReports also creates and attaches a worksheet to each slide you work with. This is important if you want to improve productivity and use Copy Slide (Setup). Change this setting if you want to control and organize the worksheets yourself.
Reorganize the Data
If you use raw data, create crosstabs first.
If you use another data source, you may need to reorganize the data. Read more about Lookup Tables, Lookup Ranges and Linked Ranges. You can also read more about handling crosstabs created using other tools.
Populate and Link
The attached workbook is shown in the Workbook Pane in PowerPoint.
You can click the
![]()
icon to open the workbook in a floating window. The functionality in the workbook window is the same as in the Workbook Pane.
You can click the
![]()
icon in the workbook window to open the workbook in Excel.
Use the Workbook Pane or Workbook Window
- Select the shape, table, or chart on the slide.
- Select a data range in the worksheet.
- Right-click the selected range.
Read more about Populate Charts, Populate Tables, and Populate Shapes.
Use Excel
- Select a range in Excel.
- Click Populate and Link in the OfficeReports ribbon tab in PowerPoint.
