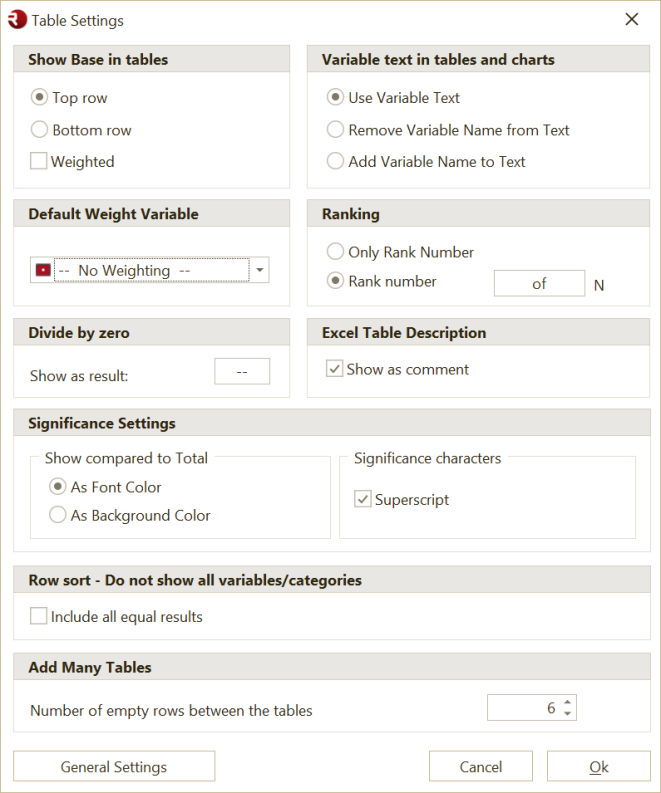
Table Settings
Use Table Settings to define the default settings that OfficeReports applies to tables in the current workbook or report.
These settings affect newly created crosstabs and tables, and help you keep table output consistent across the report.
What Table Settings controls
Use Table Settings to define defaults such as:
- where the base is shown in tables
- whether the base is weighted
- which weight variable is used by default
- how variable text is shown in tables
- how ranking is displayed
- how divide-by-zero results are shown
- how significance differences compared to total are displayed
- whether significance characters are shown as superscript
- row sorting behavior when not all categories are shown
- spacing between tables when using Add Many Tables
- whether the Excel table description is shown as a comment
Show Base in tables
Use this setting to control where the base is shown in a table.
You can place the base in:
- the Top row
- the Bottom row
You can also define whether the base is shown as Weighted.
Use this when you want all tables in the report to show the base in a consistent position and style.
Default Weight for tables
Use Default Weight for tables to select the weight variable that OfficeReports should use by default when creating tables.
Use this when:
- most tables in the report should use the same weighting
- you want to avoid selecting the weight variable manually for each table
If no weight variable is selected, tables are created without weighting by default.
Divide by zero
Use Divide by zero to define what OfficeReports should show when a calculation would otherwise return a divide-by-zero result.
For example, you may want to show:
--N/A- another standard text
This helps keep tables readable when no valid result can be calculated.
Variable text in tables
Use these settings to control how variable text is shown in tables.
Options include:
- Use Variable Text
- Remove Variable Name from Text
- Add Variable Name to Text
Use this when you want table labels to be shorter, clearer, or more descriptive.
Ranking
Use Ranking to control how rank information is shown in ranking tables.
Options include:
- Only Rank Number
- Rank number of N
Use this when you want ranking output to follow a consistent format across all ranking tables in the report.
Excel Table Description
Use Excel Table Description to define how the description of a table is shown in Excel.
For example, you can choose to show it:
- as a comment
This is useful when you want extra table information to remain available without affecting the visible layout of the worksheet.
Significance Settings
Use Significance Settings to control how OfficeReports displays significance differences compared to Total.
You can show the comparison:
- As Font Color
- As Fill Color
You can also choose whether significance characters are shown as Superscript.
These settings affect how significance results are displayed in the table.
For the statistical rules themselves, such as confidence levels, T-Test, Z-Test, minimum base, and effective base, see Statistics.
Row sort - Do not show all variables/categories
Use this setting to control how OfficeReports handles equal results when rows are sorted and not all categories are shown.
Select Include all equal results if you want OfficeReports to keep categories that have the same value as the last included result.
This is useful when you want sorting to remain fair and complete when a cutoff is applied.
Add Many Tables
Use this setting to define the number of empty rows between tables created with Add Many Tables.
This helps control the spacing and readability of automatically generated tables.
When should I use Table Settings?
Use Table Settings when you want to define defaults that should apply to tables across the whole workbook or report.
Examples:
- all tables should use the same weight variable
- divide-by-zero results should always show
-- - variable text should be shortened in all tables
- significance compared to total should use font color
- ranking tables should use the same format
When should I use a different settings page?
Use Filtering when you want to control which respondents are included in the report or table.
Use Statistics when you want to control how significance tests and statistical calculations are applied.
Use Default Table Settings when you want settings to be applied automatically when a specific variable is used in a table.
Use Table Layout when you want to control how tables look, especially in Excel versus PowerPoint.