Tables, Charts and Shapes
Use Populate the Selected ... to link workbook data to native PowerPoint tables, charts, and shapes.
- Select the shape, table, or chart on the slide.
- Select the data range in the worksheet.
- Right-click the selected range.
- Select Populate the selected ....
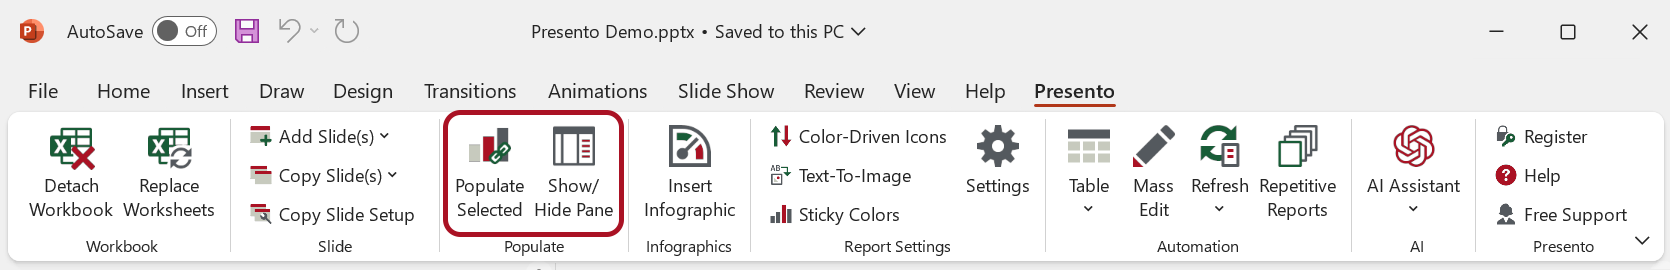
You can also click Populate Selected in the ribbon tab.
After you populate the object, the Populate Pane appears on the right side of PowerPoint. In this pane, you can define how OfficeReports displays the linked data.
For more information, see Populate Charts, Populate Tables, and Populate Shapes.