Chart Types
Use Advanced Chart Type when you want to populate a chart by using one of the advanced chart options in OfficeReports.
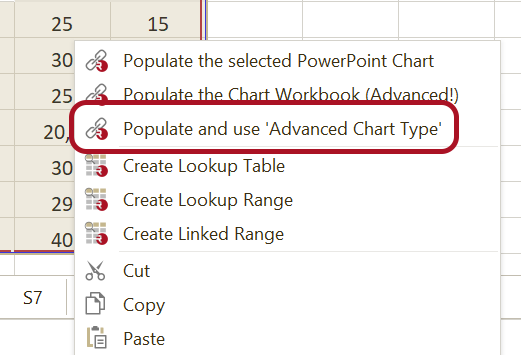
- Right-click the data range in the workbook.
- Select Populate and use 'Advanced Chart Type'.
- In the Advanced Chart Type window, choose the chart type you want to use.
- Configure any available settings.
- Click Ok.
This option is not available when you are working in Excel instead of the Workbook Pane. Just close the workbook in Excel, and it will automatically open in the WOrkbook Pane.
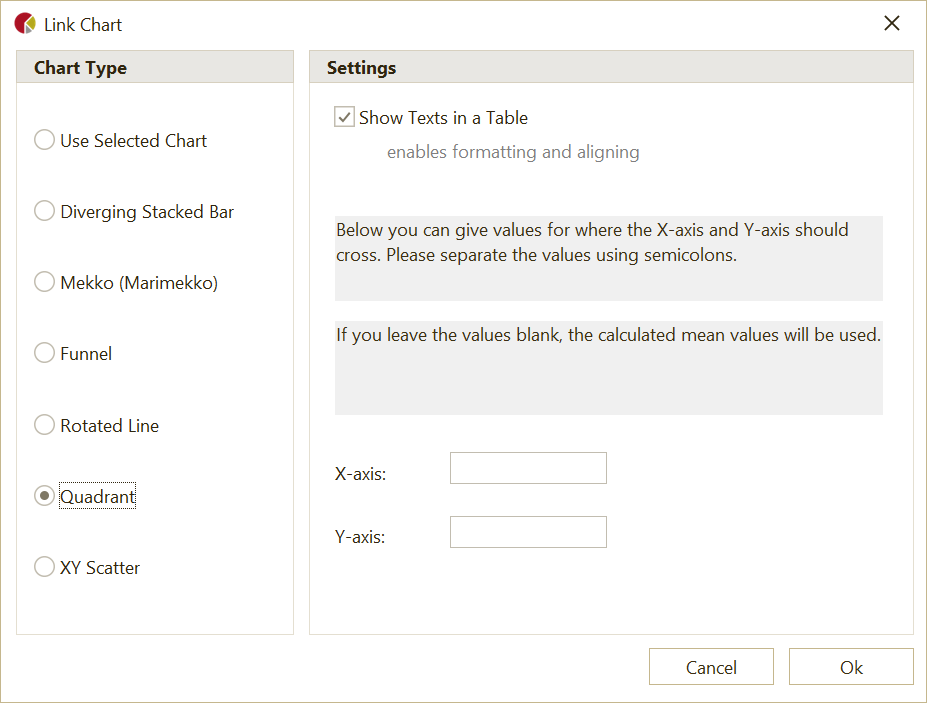
Use Selected Chart
Uses the currently selected chart.
Settings
Show Texts in a Table
Shows the texts in a table and enables formatting and aligning.
Diverging Stacked Bar
Use Diverging Stacked Bar when you want to create a diverging bar chart.
Settings
Show Texts in a Table
Shows the texts in a table and enables formatting and aligning.
Mekko (Marimekko)
Use Mekko (Marimekko) when you want to create a Marimekko chart.
Settings
Show Texts in a Table
Shows the texts in a table and enables formatting and aligning.
Width
Use Width to define the values for the column widths.
- Separate the values by semicolons.
- If you leave the values blank, OfficeReports calculates the widths from the total column weights.
- When you edit the chart later, you can also define an Excel range that contains the width values.
Funnel
Use Funnel when you want to create a funnel chart.
Settings
Show Texts in a Table
Shows the texts in a table and enables formatting and aligning.
Rotated Line
Use Rotated Line when you want to create a rotated line chart.
Settings
Y-values
Use Y-values to define the Y-values that should be used for all data columns.
- Separate the values by semicolons.
- All data columns are treated as X-values and use the same Y-values.
- If you leave the values blank, the values
0;1;2;3...are used.
Quadrant
Use Quadrant when you want to create a quadrant chart.
Settings
Show Texts in a Table
Shows the texts in a table and enables formatting and aligning.
X-axis
Use X-axis to define where the X-axis should cross the Y-axis.
- If you leave the value blank, the calculated mean value is used.
Y-axis
Use Y-axis to define where the Y-axis should cross the X-axis.
- If you leave the value blank, the calculated mean value is used.
XY Scatter
Use XY Scatter when you want to create an XY scatter chart.