Populate a PowerPoint Shape
Use Populate the selected Shape to link workbook data to a selected PowerPoint shape. After you link the shape, OfficeReports can refresh it when the data changes.
Populate a Shape
- Select the shape in PowerPoint.
- In the Workbook Pane, select the data range you want to use.
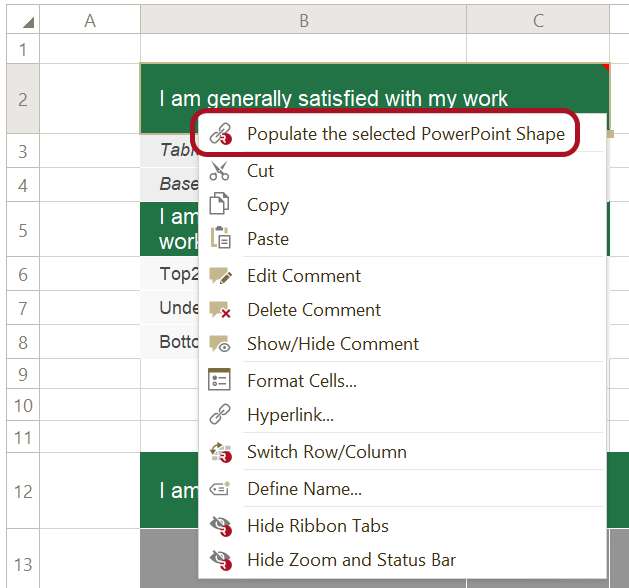
- Right-click the selected range.
- Select Populate the selected Shape.
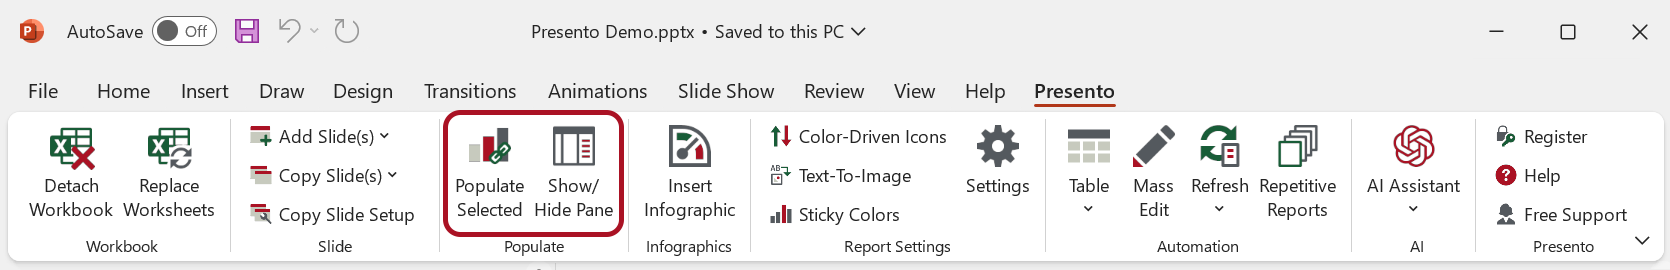
If you are working in Excel instead of the Workbook Pane:
- Select the shape in PowerPoint.
- Select the data range in Excel.
- Click Populate Selected in the ribbon tab in PowerPoint.
After you populate the shape, OfficeReports links it to the selected data range. When the data changes, you can refresh the shape.
When you select a linked shape, the Populated Pane appears on the right side.
Use Text from Multiple Cells
If you select multiple cells, OfficeReports combines the text from those cells.
- OfficeReports adds a space between texts from different cells on the same row.
- OfficeReports adds a new line between texts from cells in different rows.


You can edit the link settings in the Populated Pane after the shape is linked.