Report and Segment Filters
Use Report and Segment Filters to define the default filtering for the report.
The visible report is filtered by:
- Report Filter
- AND Segment1
- AND Segment2
- AND Segment3
for every segment filter that is defined.
These filters affect all OfficeReports tables, charts, and lists in the report.
For a broader explanation of filtering levels, table-level filtering, category-level filtering, and ignore-filter settings, see Filtering.
Report Filter
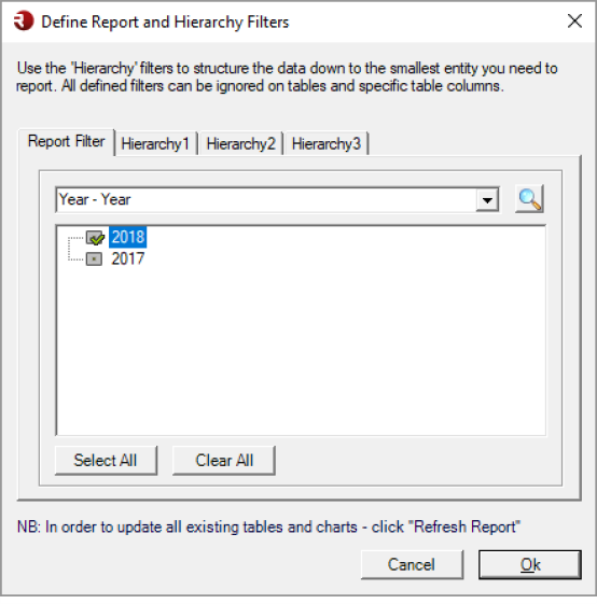
Use Report Filter to define the main filter for the report.
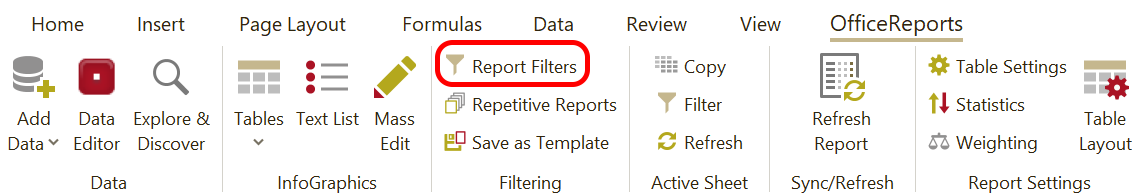
- Click Report Filters on the OfficeReports ribbon.
- Select the variable you want to use.
- Select one or more categories.
- Click OK.
- Click Refresh Report to update all existing tables and charts.
When you select more than one category, OfficeReports treats the selection as an OR condition.
For example, if you select:
- Wave 7
- Wave 8
then the report includes respondents from Wave 7 or Wave 8.
If you need filtering based on a combination of variables, create a derived variable and use that variable in the Report Filter.
Segment Filters
Use Segment1, Segment2, and Segment3 to add more report-level filters.
These filters work in the same way as the Report Filter: they further narrow the visible report output.
For example, if you define:
- Report Filter =
Wave 8 - Segment1 =
Finance - Segment2 =
BKP
then the report shows respondents that match:
Wave 8 AND Finance AND BKP
If a segment filter is not defined, it is not part of the filter logic.
Why use Segment Filters?
Segment Filters are used to structure the data down to the smallest entity you need to report.
For example:
- Report Filter can define the current wave or period
- Segment1 can define the department
- Segment2 can define the team
- Segment3 can define another level such as market, country, or manager
This makes it possible to set up one report that follows the same filtering structure throughout all tables and charts.
Segment Filters in batch generation
Segment Filters also have an additional use in batch generation.
When you use Batch Reports or Batch Reports for PowerPoint, OfficeReports can generate one report for each selected combination of Segment1, Segment2, and Segment3 categories.
For example:
- Segment1 could contain departments
- Segment2 could contain teams
OfficeReports can then generate one report for each department/team combination.
Lower-level filtering can ignore these filters
The Report Filter and Segment Filters define the default filtering for the report.
At lower levels, OfficeReports can ignore one or more of these active filters:
- a table can ignore filters for the whole crosstab
- a category can ignore filters for one category or column only
This makes it possible to create comparison columns such as:
CompanyDepartmentLast Year
even when the report itself is filtered to a smaller segment.
Read more about this in Filtering.
When should I use Report and Segment Filters?
Use Report and Segment Filters when:
- the whole report should be limited to a specific wave, period, market, department, team, or segment
- all tables, charts, and lists should follow the same default filtering logic
- you want to structure the report down to the smallest reporting entity
- you want to prepare the report for batch generation by Segment1, Segment2, and Segment3