Report Settings
Use Report Settings to define the default settings for the report before you create tables. Setting these defaults can save time when you create tables.
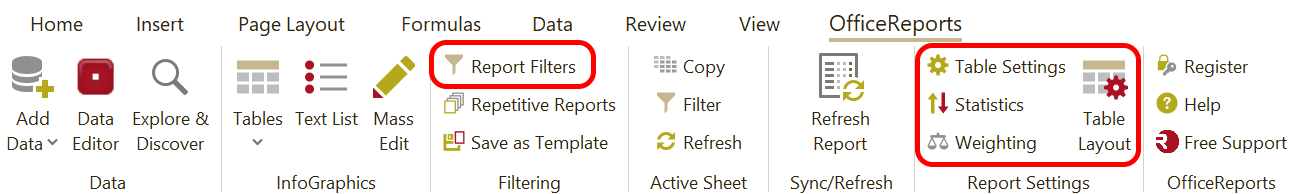
Table Layout
Use Table Layout to define default layout settings for tables.
You can define:
- the number of decimals shown for percentages and mean values
- whether Total and Mean are shown in the first row or column
- whether the percent character is shown
- whether final results in Excel are rounded so the value matches the formatting
Read more about Table Layout.
Variables
Use the variable window to define default table settings for variables you use often.
You can define defaults for:
- significance testing
- sorting
- minimum base for categories
Read more about Default Table Settings.
Table Settings
Use Table Settings to define additional default settings for the report.
You can define defaults for:
- the weight variable
- zero-base text, for example
N/A - ordinal variables and their default statistics
These settings control, for example, whether a table includes a Mean row or column and a Total row or column by default.
Report Filters
Use Report Filters when your dataset contains data you want to limit at report level, for example previous periods.
For example, if your dataset contains both current and previous periods, you may need to set the Report Filter to the current period.
Read more about Filtering.