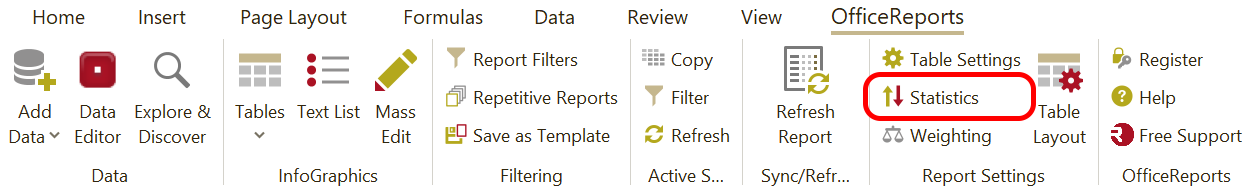
Statistics
Use Statistics to define the statistical methods, thresholds, and calculation rules that OfficeReports uses in tables and charts.
These settings control how significance tests and other statistical calculations are carried out.
If you want to define which columns are compared in a specific table or chart, or how significant differences are visualized, see Significance Testing.
When your dataset is a sample rather than a full population, there is uncertainty when you apply the results to the population. OfficeReports provides statistical tests and related settings that help you determine whether differences in tables and charts are statistically significant or whether they may be due to chance.
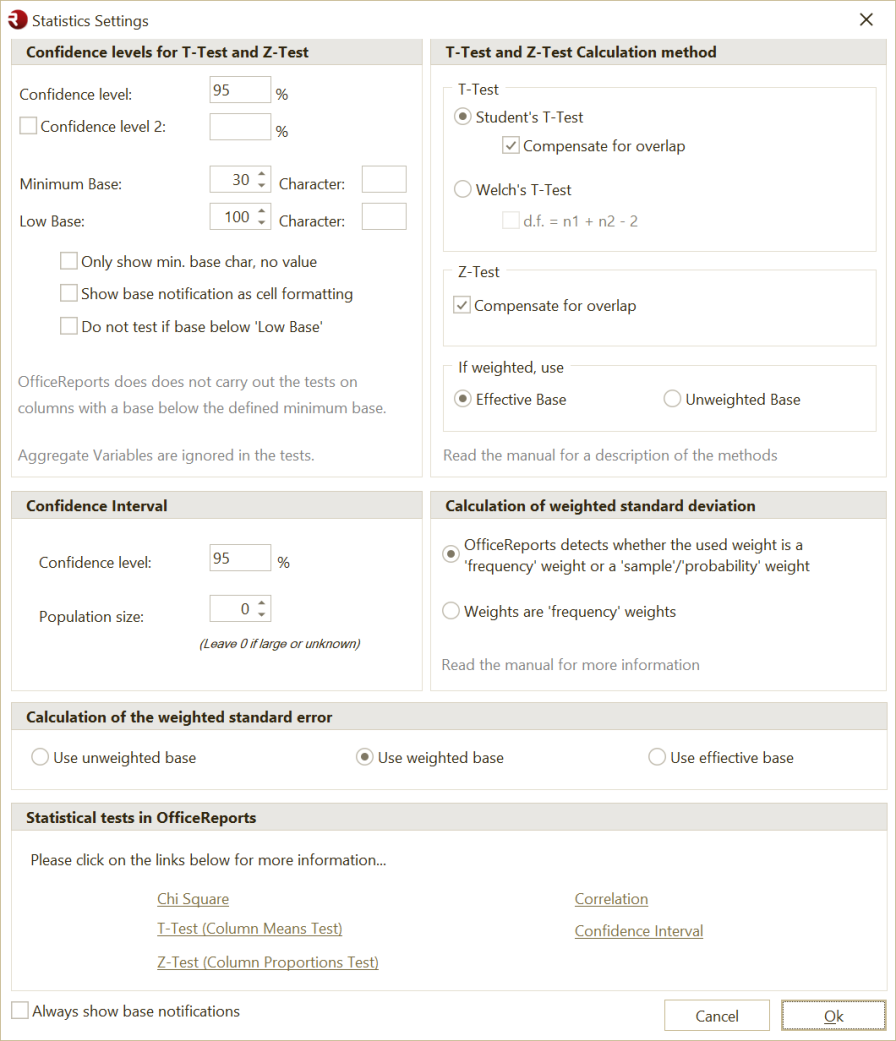
When you click Statistics, OfficeReports opens this window:
What Statistics controls
Use Statistics to define settings such as:
- confidence levels for T-Test and Z-Test
- minimum base and low base thresholds
- T-Test and Z-Test calculation method
- whether to compensate for overlap
- whether weighted tables use effective base or unweighted base in tests
- confidence interval settings
- how weighted standard deviation is calculated
- how weighted standard error is calculated
- Chi Square and related statistical tests
Confidence levels for T-Test and Z-Test
Use Confidence Levels to define the confidence level for:
- Z-Test for column proportions
- T-Test for column means
The default setting is 95%, but you can select levels from 99% down to 50%.
By default, OfficeReports displays significant differences by using:
- uppercase characters for the first 26 columns
- lowercase characters for the next 26 columns, if Confidence Level 2 is not used
- special characters up to column 96
You can also add Confidence Level 2. This level must be lower than Confidence Level 1. OfficeReports displays differences for this level by using lowercase characters, or different significance colors.
This makes it possible to show two significance levels in the same table, for example 95% and 90%.
Minimum Base and Low Base
Use Minimum Base and Low Base to define base thresholds for significance testing.
OfficeReports recommends a minimum base of 30.
If you define a Minimum Base character, OfficeReports adds that character to values where the base is below the minimum.
If you define a Low Base character, OfficeReports adds that character to values where the base is below the low base threshold.
You can also define whether:
- only the minimum-base character is shown
- the low-base marker is shown as cell formatting
- significance testing should be skipped when the base is below the low-base threshold
- low-base markers should always be shown
Note: Base notifications are based on the unweighted base.
T-Test and Z-Test calculation method
Use these settings to define how OfficeReports carries out significance tests.
T-Test
Use T-Test to compare column means in a table row and test whether the mean in one column is significantly different from the mean in another column.
By default, OfficeReports uses Student's T-Test and compensates for overlap.
You can also select Welch's T-Test. This test does not assume equal variances and calculates the degrees of freedom from the group sizes and variances.
Z-Test
Use Z-Test to compare column proportions row by row.
This test checks whether the proportion in one column is significantly different from the proportion in another column.
The proportion is calculated as the cell count divided by the column base.
You can also define whether OfficeReports should compensate for overlap.
If weighted, use
When tables use weighting, OfficeReports can use different base definitions in significance tests.
Options include:
- Effective Base
- Unweighted Base
By default, OfficeReports uses the Effective Base in statistical tests instead of the simple weighted base.
This setting only affects weighted tables.
The effective base reduces the risk of showing significant differences caused by weighting adjustments rather than real differences in the data.
Confidence Interval
Use Confidence Interval to show the uncertainty around a result.
The Confidence Level defines how certain you want to be when you interpret a result. For example, if you use a confidence level of 95%, this means you can be 95% confident that:
- a reported difference is significant
- the true population result falls within the confidence interval
For example, if a result is 11% with a confidence interval of +/- 1.1, the true population result is expected to be between 9.9% and 12.1% at the selected confidence level.
When you add confidence intervals to a table, OfficeReports assumes by default that:
- the sample represents a large population
- the sample is less than
10%of the population
If the sample represents more than 10% of the population, enter the Population Size to adjust the calculation.
You can only add confidence intervals to frequency tables.
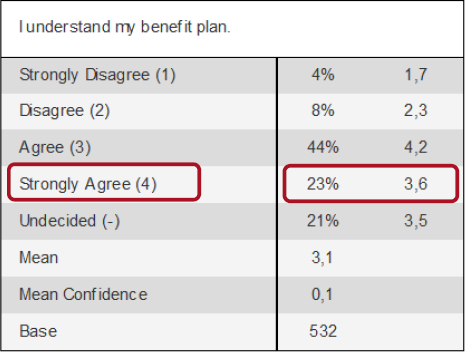
OfficeReports adds:
- an extra column that shows the confidence interval
- an extra row for the mean confidence interval if the table contains a Mean row
Calculation of weighted standard deviation
Use this setting to define how OfficeReports calculates weighted standard deviation.
OfficeReports can:
- detect whether the used weight is a frequency weight or a sample/probability weight
- or treat the weights as frequency weights
Use this when weighted statistics should follow a specific interpretation of the weight variable.
Calculation of the weighted standard error
Use this setting to define how OfficeReports calculates weighted standard error.
Options include:
- Use unweighted base
- Use weighted base
- Use effective base
This is especially relevant for weighted tables and charts.
Chi Square and related tests
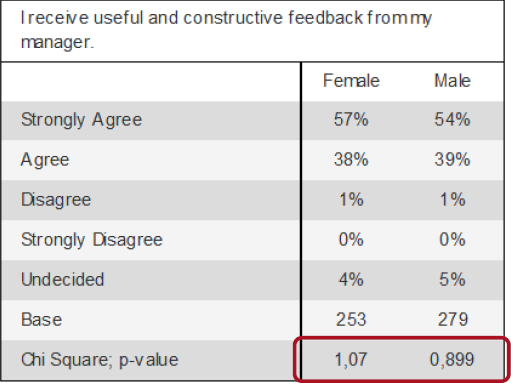
Use Chi-Square Test in cross tables to test whether the variables in the rows and columns are independent.
For example, you can use this test to determine whether differences in ratings depend on gender.
OfficeReports also provides related statistical options and links for topics such as:
- Chi Square
- T-Test (Column Means Test)
- Z-Test (Column Proportions Test)
- Correlation
- Confidence Interval
When should I use Statistics?
Use Statistics when you want to define the statistical rules used across tables and charts.
Examples:
- change the confidence level from
95%to90% - change the minimum base or low base threshold
- choose Student's T-Test or Welch's T-Test
- define how weighted tables should handle the base in significance testing
- add confidence intervals
- control weighted standard deviation or weighted standard error settings
When should I use a different settings page?
Use Significance Testing when you want to define:
- which columns should be compared
- whether to use pairwise testing or specific column combinations
- how significant differences should be visualized in a specific table or chart
Use Table Settings when you want to define default table settings such as:
- default weight for tables
- how significance compared to total is displayed
- whether significance characters are shown as superscript
Use Table Layout when you want to control how tables look and how significance colors are displayed.
Use Filtering when you want to control which respondents are included in the report or table.