Using Color-Driven Icons
Use Color-Driven Icons to show icons such as arrows in PowerPoint tables and charts based on the fill color or font color in linked workbook cells.
This helps you avoid manual updates, position icons consistently, and reuse the same icon definitions in other tables, charts, and presentations.
Create Color-Driven Icon Definitions
Before OfficeReports can show icons automatically, you must define which icon to use for each fill color or font color. Please have a look at this video showing how to do that.
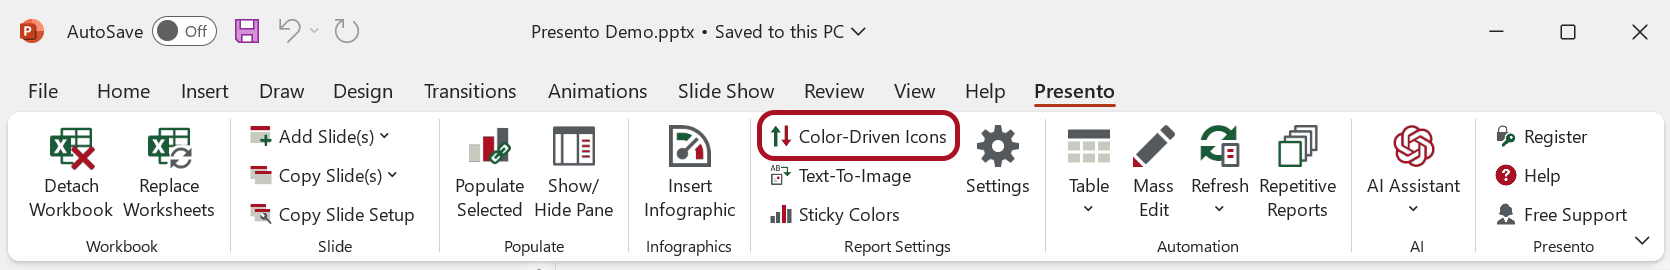
Click Color-Driven Icons in the ribbon tab to open the definition window.
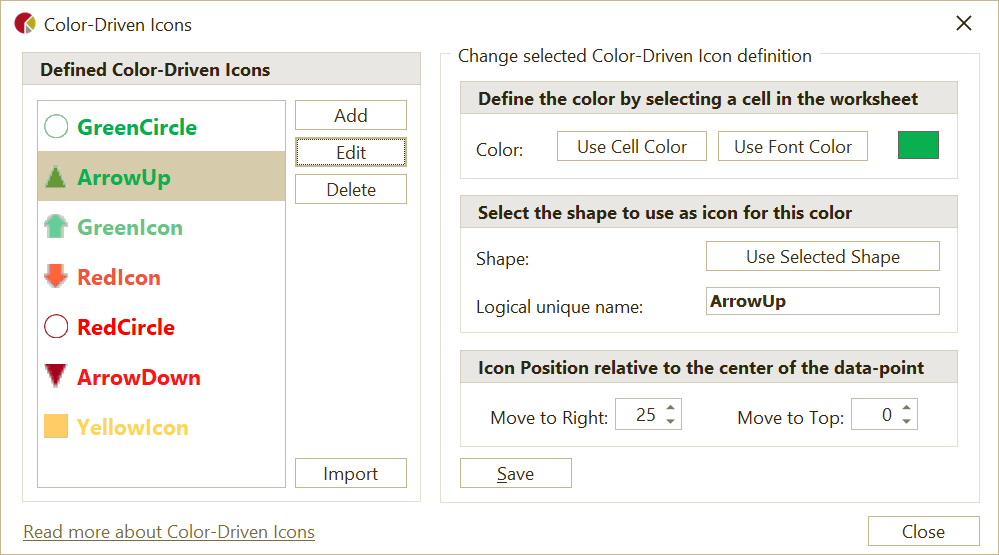
Define a Color-Driven Icon
- Select a cell in the workbook that contains the fill color or font color you want to use.
- Click Use Cell Color or Use Font Color.
- Select the shape you want to use as the icon.
- Click Use Selected Shape.
- Set the icon position relative to the center of the data.
You may need to adjust the position a few times to get the result you want, especially when you use arrows or other shapes that require precise placement.
Note: Negative position values move the icon to the left or down.
Note: OfficeReports copies the selected shape to slide 1 and hides it. Do not delete this hidden shape.
Apply Color-Driven Icons
After you define the icons:
- Select the table or chart in PowerPoint.
- Open the Populate Pane.
- Select Show Color-Driven Icons.
The table or chart then shows the defined icons based on the fill color or font color in the linked workbook cells.
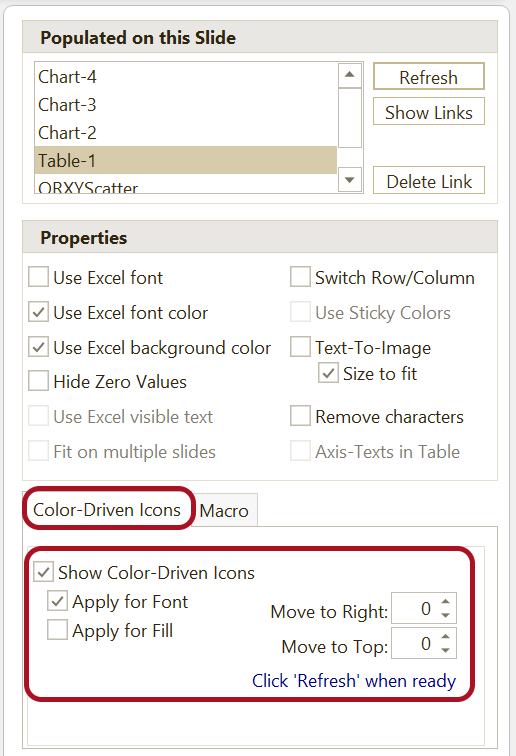
You can override the default icon position in the Populate Pane.
Use Different Icons for the Same Color
You can override a defined icon on a specific slide.
- Add another shape to the slide.
- Give the shape the same name as the defined logical unique name.
OfficeReports first looks for a shape with that name on the current slide. If no matching shape exists on the slide, OfficeReports uses the shape stored on slide 1.