Populate a PowerPoint Table
Use Populate the selected Table to link workbook data to a selected PowerPoint table. After you link the table, OfficeReports can refresh it when the data changes.
Populate a Table
- Select the cell in the PowerPoint table where you want the data to start.
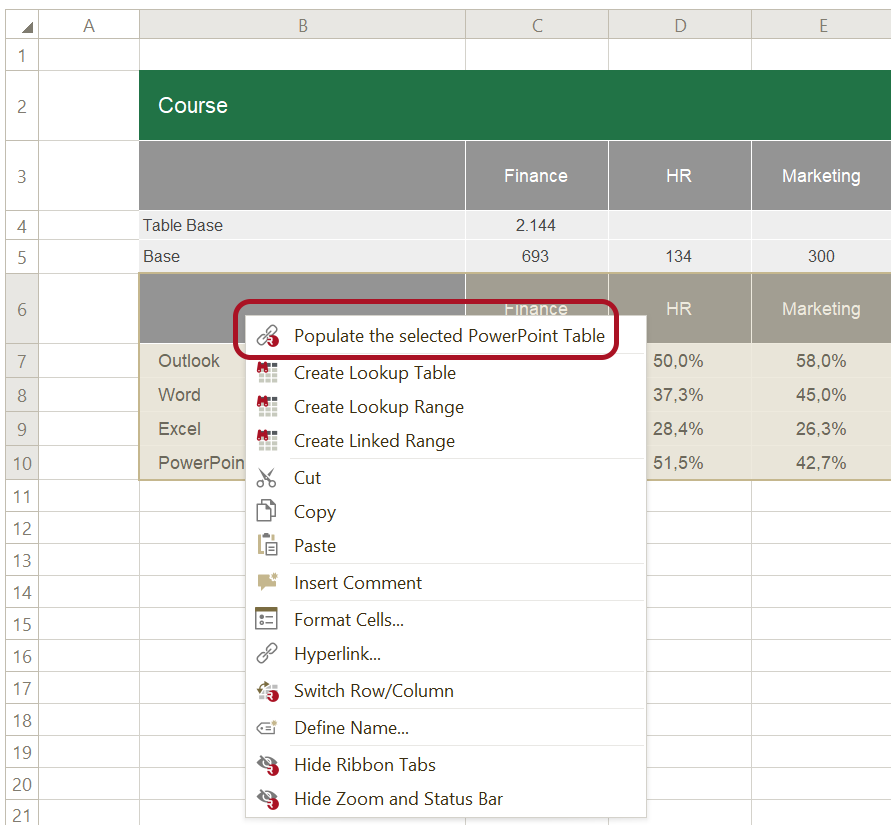
- In the Workbook Pane, select the data range you want to use.
- Right-click the selected range.
- Select Populate the selected Table.
If you are working in Excel instead of the Workbook Pane:
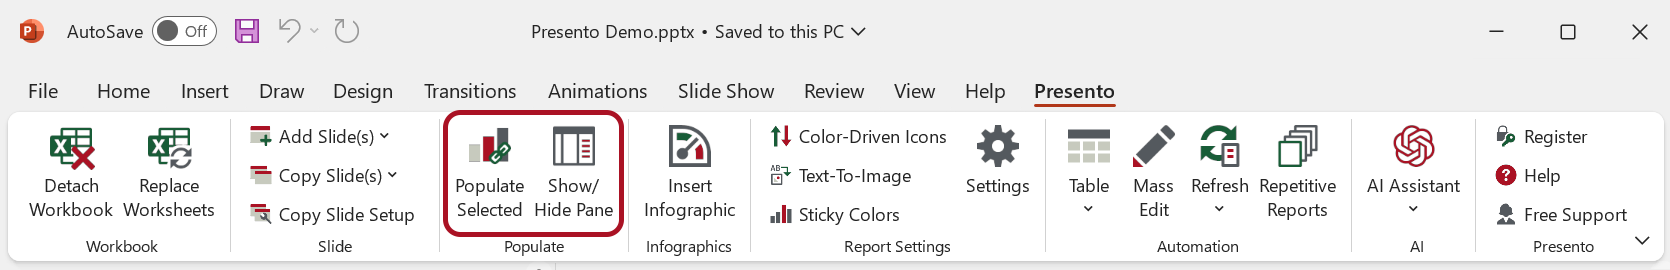
- Select the cell in the PowerPoint table where you want the data to start.
- Select the data range in Excel.
- Click Populate Selected in the ribbon tab in PowerPoint.
After you populate the table, OfficeReports links it to the selected data range. When the data changes, you can refresh the table.
When you select a linked PowerPoint table, the Populated Pane appears on the right side. In this pane, you can change the populate settings.
Conditional Formatting
If the workbook range contains fill colors or font colors, for example from conditional formatting or pairwise significance comparisons, OfficeReports can visualize these colors in PowerPoint by using font color, fill color, or icons.
Read more about Color-Driven Icons.
Table Settings
In the Properties box, you can control how OfficeReports displays the Excel data in the PowerPoint table.
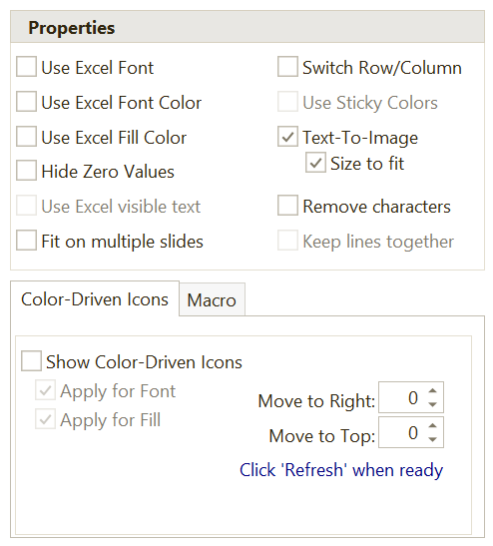
For example:
- Use Excel Fill Color makes the fill colors in the PowerPoint table match the fill colors in the linked Excel range.
- Text-To-Image replaces specific texts with images. Define which image to use for each text in Text-To-Image.
- Remove characters removes characters from numbers, for example significance characters.
Show Color-Driven Icons
OfficeReports can add icons to tables based on the fill color of the linked cells in Excel.

The fill colors in Excel can then be shown as shapes in the PowerPoint table.
Read more about Color-Driven Icons.

Dynamic Sizing
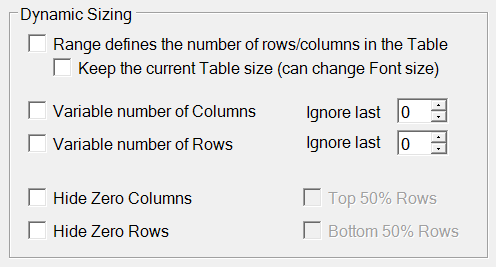
Use Dynamic Sizing when the number of rows or columns in the PowerPoint table can change.
This helps automate report updates that would otherwise require manual resizing.
Let the Range Define the Number of Rows and Columns
- Add or select a table in PowerPoint.
- Select the upper-left cell if that is where the data should start.
- Select the data range in Excel.
- In the task pane, click Add Link to selected Table.
- Select Range defines the number of rows/columns in the Table.


Keep the Current Table Size
Use Keep the current Table size to keep the table size unchanged when OfficeReports adds or removes rows and columns.
In some cases, OfficeReports may not be able to keep the exact size when rows or columns are added.
Variable Number of Columns
Use Variable number of Columns when OfficeReports should continue adding columns to the right of the selected range as long as those columns contain data.

Variable Number of Columns - Offset
When you use Variable number of Columns, OfficeReports includes all columns until it reaches the first empty column outside the selected range.
Use Offset X Columns when you want to exclude the last one or more columns that contain data.
For example, if you set Offset to 1, OfficeReports excludes the last data column.
Variable Number of Rows
Use Variable number of Rows when OfficeReports should continue adding rows below the selected range as long as those rows contain data.
This works the same way as Variable number of Columns.
Variable Number of Rows - Offset
Use Offset together with Variable number of Rows when you want to exclude the last one or more rows.
For example, if the selected range defines the table size but you do not want to include the last row:
- Select Variable number of Rows.
- Set Offset to
1.
The result is a table where the last row from the linked Excel range is excluded.

Hide Zero Columns
Use Hide Zero Columns when the selected data range contains columns with no data.

When you select this option, OfficeReports hides those columns in the PowerPoint table.

Hide Zero Rows
Use Hide Zero Rows to hide rows with no data.
This works the same way as Hide Zero Columns.
Advanced (Run Macro)
If you need functionality beyond the standard OfficeReports features, you can define a VBA macro to run each time OfficeReports updates the link.
This makes it possible to create custom table behavior.
Read more about VBA Macros.