Populate the PowerPoint Chart Workbook
Use Populate the Chart Workbook to write workbook data to the workbook behind a selected PowerPoint chart.
Use this option when OfficeReports should not redefine the chart series automatically. OfficeReports writes the selected data to the chart workbook only.
This is useful when the chart already uses a non-standard data source definition that you want to keep.
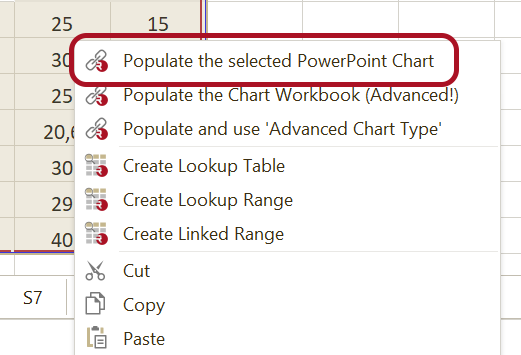
Populate the Chart Workbook
- Select the chart in PowerPoint.
- In the Workbook Pane, select the data range you want to use.
- Right-click the selected range.
- Select Populate the Chart Workbook.
After you populate the chart workbook, OfficeReports links the chart to the selected data range. When the data changes, you can refresh the chart.
Set Source Data Manual
If the chart is already linked, you can use Set Source Data Manual to achieve the same result as Populate the Chart Workbook.
Use this option when you want OfficeReports to write the data to the chart workbook without redefining the chart series automatically.
When the workbook is open in Excel, Populate the Chart Workbook is not available directly. In that case, use Set Source Data Manual instead.