Reorganize Ranges for PowerPoint
Before you populate tables and charts in PowerPoint, you often need to reorganize the data in the workbook. OfficeReports provides three methods for this: Lookup Tables, Lookup Ranges, and Linked Ranges.
Lookup Tables and Lookup Ranges are search-based methods. They are well suited for report automation because OfficeReports can still find the correct data even if the workbook layout changes between reporting periods.
All three methods are similar to linking to ranges in Excel. In Excel, a link only returns the values from a fixed range. In OfficeReports, the linked range is flexible and also keeps the formatting from the source range, including font color and fill color. OfficeReports can use these colors to display icons, such as arrows, in PowerPoint presentations. Read more about this in Color-Driven Icons.
Note: This functionality is only available in the OfficeReports App and in the Workbook Pane in PowerPoint. It is not available in Excel.
Linked Ranges
Use Linked Ranges when you want to link directly to a selected range in the workbook.
Linked Ranges are often used when you want to combine the results of multiple crosstabs or grid tables into one final table or range that is ready for population in PowerPoint.
This is especially useful when the final PowerPoint table or chart needs to bring together results from different parts of the workbook.
In these situations, ordinary Excel links are often not sufficient, because they only return the cell values. They do not preserve the font color and fill color that may be used to visualize significant differences.
A Linked Range keeps both the values and the formatting from the source range. This makes it possible to use significance colors in the final Excel range and then visualize them in PowerPoint, for example by using Color-Driven Icons.
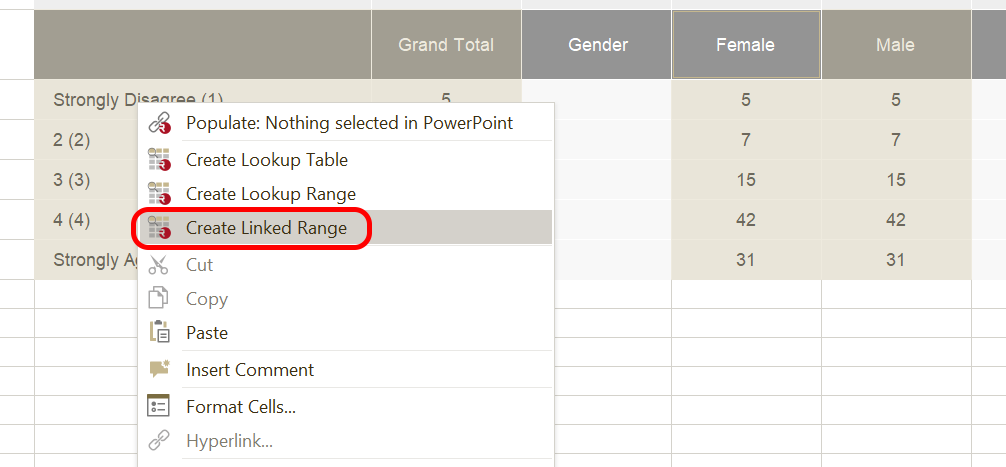
- Select the range in the workbook.
- Right-click the selected range.
- Select Create Linked Range.
- Click the cell where you want to create the Linked Range.
The Linked Range is created when you click the destination cell.
The selected range can contain multiple regions.
Lookup Tables
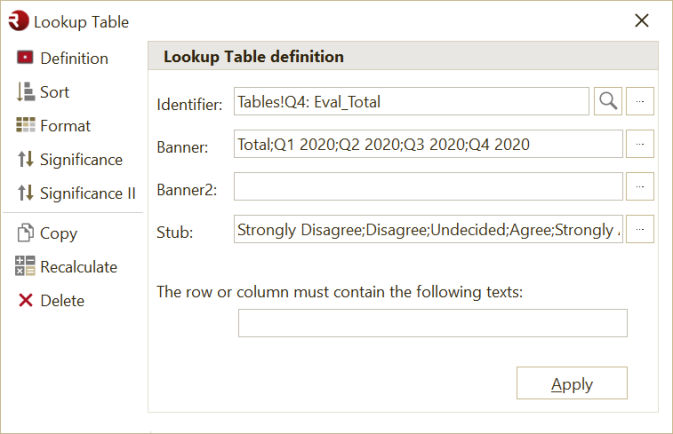
A Lookup Table starts by searching for an identifier.
If the identifier contains a worksheet name before a ! character, OfficeReports searches only that worksheet.
From the cell that contains the identifier text, OfficeReports searches for cells that match the texts defined in the banner, banner2, and stub. The banner, banner2, and stub contain search texts separated by semicolons.
If OfficeReports finds multiple matching cells for a combination of these texts, it uses the cell that contains a percentage value if possible.
If one of the matching cells contains significance characters, OfficeReports can use that information in different ways.
Significance
OfficeReports can visualize significance by using background colors or font colors.
To do this, define a pairwise comparison in the Significance tab. Enter a text string that contains the significance characters for pairs of columns, separated by semicolons.
OfficeReports shows the significance in the first mentioned column.
For example, if you define BA; DC, OfficeReports:
- Compares column A with column B and shows the significance color in column B.
- Compares column C with column D and shows the significance color in column D.
If you need to compare more than two columns at the same time, you can show significance characters in the Lookup Table.
For example, to compare columns D, E, and F and columns G, H, and I, enter DEF; GHI in the Significance II tab.
In the Lookup Table, OfficeReports renames all used columns so the table starts with significance character A again.
Lookup Ranges
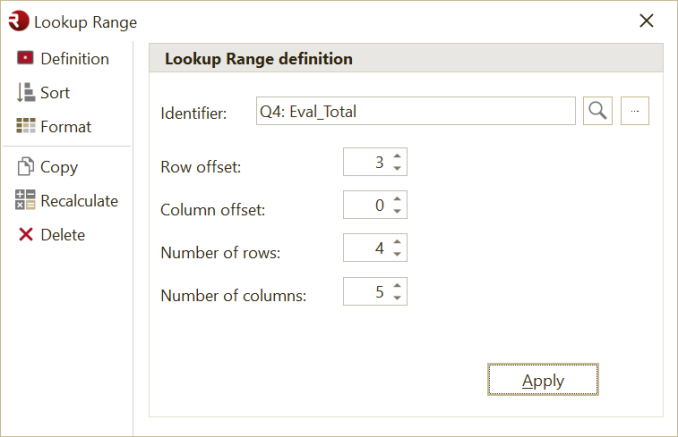
Use a Lookup Range when you do not have banner and stub texts.
A Lookup Range selects a specific range of cells relative to the cell where the identifier is found.
Sorting
You can sort both rows and columns in all three table types.
Formatting
All three table types keep the formatting from the source range, including font color and fill color.