Reorganizing External Crosstabs
Use OfficeReports features to reorganize already aggregated data in Excel workbooks. This helps you work with crosstabs when the data you need is not always in the same range, when you want to combine values from different areas, or when you want to keep the original formatting.
For example, you may want to populate a chart with percentages from a crosstab that also contains counts. You may also want to automate monthly report production even though the source tables move between workbook versions. If you use standard Excel formulas, you lose the original formatting and only keep the cell values.
To solve this, OfficeReports provides three features: Lookup Table, Lookup Range, and Linked Range. Each feature creates a new range where every cell contains a formula that refers to an original cell.
Lookup Table
Use a Lookup Table to turn a standard crosstab into a table that is easier to work with. This is useful when the crosstab contains items such as counts, percentages, and significance characters.
- Select the cell that contains a unique table name on the worksheet.
- Select the cells that contain the banner you want to use.
- Select the cells that contain the stub.
- Right-click and select Create Lookup Table.
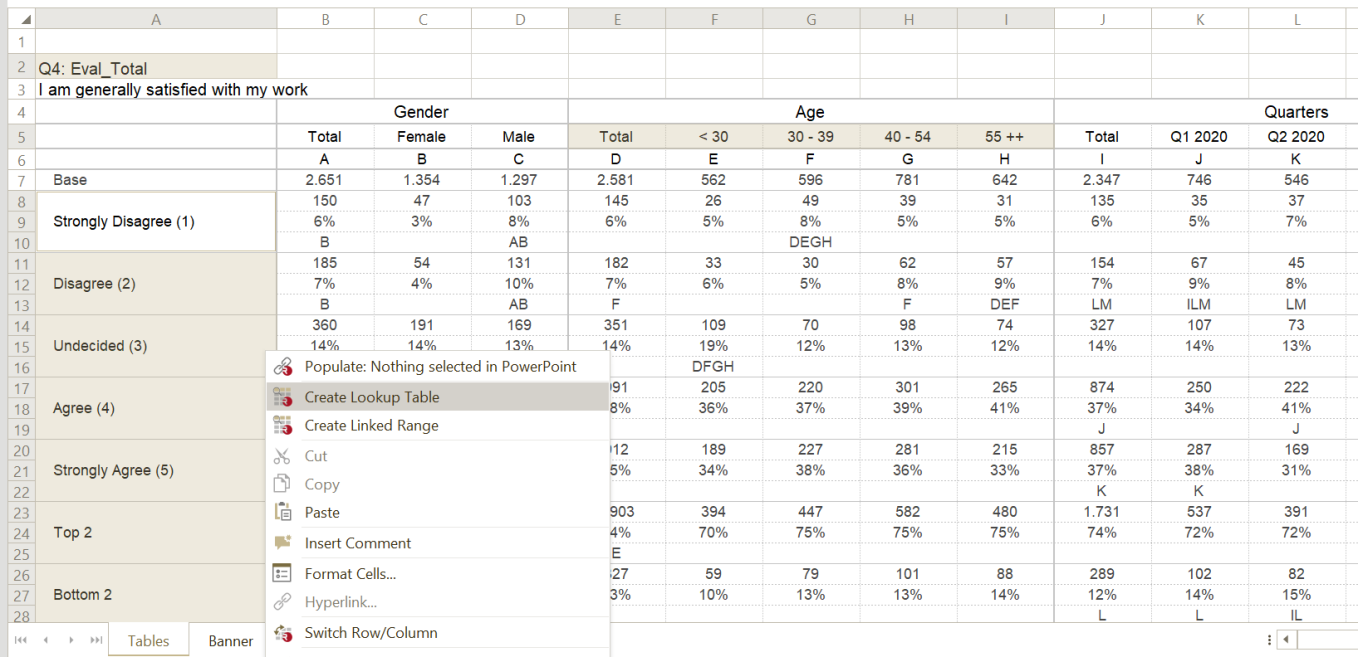
- Click the cell where you want to create the Lookup Table.
You can format and sort a Lookup Table. You can also show significant differences read from the original table.
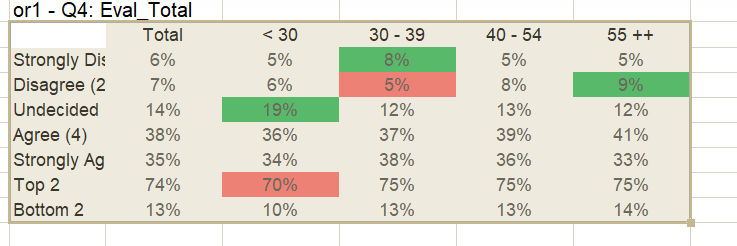
You can use the resulting table to populate a table or chart in PowerPoint and show significant differences by using icons such as arrows.
A Lookup Table works as a search function. OfficeReports searches for the defined texts and creates the table based on the matching cells. Because of this, you can still update the Lookup Table even if the original table moves to another location in an updated workbook. This makes Lookup Tables useful for report automation.
To edit a Lookup Table, double-click it. The banner and stub appear in the defined order. You can edit the texts, or right-click the texts to reverse the order of the banner or stub.
Lookup Range
Use a Lookup Range when you want functionality similar to a Lookup Table, but without defining a banner and a stub.
Instead, you define the position of the range relative to the identifier.
Linked Range
Use a Linked Range to link cells directly to other cells.
A Linked Range shows the following from the original cell:
- Value
- Font
- Font color
- Fill color
You can use a Linked Range to build a table from ranges located in different source tables.