Recoding Variables
Use derived variables to recode variables so you can create the tables and charts you need. OfficeReports includes built-in features for merging and grouping categorical variables, creating periods from date variables, and creating intervals and quantiles from numeric variables. You can also create your own variables by using formulas.
All derived variables are based on formulas. You can edit these formulas directly or by using the Formula Editor, where you can also read more about variable references, category references, operators, and conditional expressions.
Derived variables, like original variables, contain observations for cases. This means you cannot calculate NPS by subtracting the category Detractors from the category Promoters. To calculate NPS, see NPS.
Simple Recodes
In OfficeReports, you normally do not change original variables, which have a red icon. You may need the original variables again when you import more data. Instead, create a copy of the variable and recode the copy.
- Select the original variable.
- Right-click the variable and select Copy, or select New Variable > Copy selected variable.
- Expand the new derived variable with the blue icon.
- Select the categories you want to merge.
- Right-click the selected categories and select Merge, or click Categories.
If you need to apply the same recode to multiple variables, use Create other variables like this one and select the variables you want to recode in the same way.
Intervals, Quantiles, and NPS
Many datasets contain numeric data that is easier to report as intervals or categories. For example, you can group an age variable into age bands or convert a numeric scale into separate categories.
When you select a numeric variable, OfficeReports shows four buttons on the right side.
Create Intervals
Use Create Interval Variable to divide a numeric variable into intervals.
- Select the numeric variable.
- Click Create Interval Variable.
- Select the number of intervals.

A new derived categorical variable appears in the variable list with a blue icon.

OfficeReports uses the same text as the original variable. The new variable name is based on the original variable name with Intervals added.
To adjust the interval variable:
- Edit the variable name or text in the fields on the right.
- Select a category under the new interval variable.
- Edit the formula in the box at the bottom right.
- Click Save.
To add more categories:
- Open Categories.
- Select New Category.
- Enter a category name.
- Add a formula.
You can now use the new variable in tables and charts.
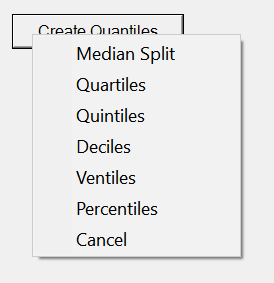
Create Quantiles
Create quantiles the same way you create intervals.
- Select the numeric variable.
- Click Create Quantiles.
When you use a quantile variable in a table or chart definition, OfficeReports recalculates the quantiles based only on the cases included in the result.
NPS
The Net Promoter Score (NPS) is calculated as the difference between two sets of percentages, most commonly the percentage of respondents who rate a brand 8 to 10 minus the percentage who rate it 6 or less.
If your dataset contains a numeric NPS variable with values from 0 to 10, you can create an NPS variable directly.
- Select the numeric NPS variable.
- Click Create NPS Variable.
OfficeReports creates a derived categorical variable with these categories:
- Detractors
- Passives
- Promoters
These categories have the values -100, 0, and 100. This means the Mean in the table equals the NPS score. If the variable name contains NPS, OfficeReports writes NPS instead of Mean in the table.
If the original variable is categorical and already contains these three categories, use these rules to calculate the NPS score in tables and charts:
- Include
NPSin the variable name. - Set Promoters to the value
100. - Set Passives to the value
0. - Set Detractors to the value
-100.
With these settings, you can select NPS in the table definition to add the NPS score to the table.
Create Categories
Sometimes a dataset contains the results of a scale question without labels. In that case, OfficeReports imports the variable as numeric. You can add labels by creating categories.
- Select the numeric variable.
- Click Create Categories.
- Edit the category texts in the new derived variable.
This video shows an example: [From Numeric to Categorical Variable](http://screencast-o-matic. com/u/FeJ/FromNumericToCategoricalVariable)
Video: From Numeric to Categorical Variables
Periods
Use Create Periods to divide a date variable into periods.
- Select the date variable.
- Click Create Periods.
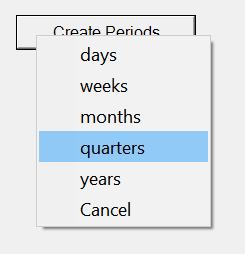
The new derived variable contains categories that divide the dates into the selected periods.
Aggregate Variables
Use an aggregate variable when you want to show the average of several variables.
- Create a new variable.
- Enter a name and text.
- Select the type Aggregate.
- Click Set Content.
- Select the variables to include.
The aggregate variable shows the sum of the included variables divided by the number of variables.
This video shows how to define a derived aggregate variable: Video: Aggregate Variable
Merge Variables
You can merge categorical variables by selecting them and right-clicking Merge, or by selecting New Variable > Merge Variables.
The result depends on whether the variables contain identical categories.
Merge Variables with Identical Categories
If two variables contain the same categories, for example A, B, and C, OfficeReports creates a new variable with the same categories. Each category is based on an OR condition.
Examples:
- A:
(Variable 1 = A or Variable 2 = A) - B:
(Variable 1 = B or Variable 2 = B) - C:
(Variable 1 = C or Variable 2 = C)
You can also merge more than two variables this way.
Merge Variables with Different Categories
If you merge variables with different categories, OfficeReports creates combinations of the categories.
Example:
- Variable 1 contains Male and Female
- Variable 2 contains East and West
The merged variable contains:
- Male and East
- Male and West
- Female and East
- Female and West
The selection order matters. If you select Variable 2 before Variable 1, the result becomes:
- East and Male
- West and Male
- East and Female
- West and Female
Group Variables
Multiple response questions are often imported as several variables, one for each answer option. OfficeReports supports this by grouping the variables.
To group variables automatically, click Find groups by name. OfficeReports groups variables with similar labels, such as Q1_1, Q1_2, and Q1_3, into one variable named Q1.
If the automatic result is not correct, group the variables manually.
- Open the variable window.
- Select New Variable > Group Variables.
- Select the variables you want to group.
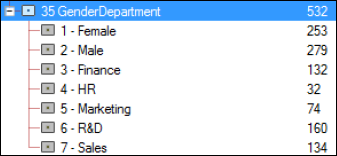
Group Different Variables
If you group different variables, OfficeReports creates a derived variable that contains the combined categories from those variables.
Example:
If you group Gender and Department, the new variable contains the categories from both variables.
Group Variables with the Same Category Texts
If multiple variables contain the same category text, OfficeReports can replace the repeated category text with the variable names.
Example:
The test dataset contains four variables regarding relations to other departments. Each variable contains one category, '1' = 'a relation'.
We can produce a derived variable based on these four variables, but as the category name in each variable is the same it is relevant to replace it by the name of the underlying variable:! [Example of multiple response group](/Resources/Images/OfficeReports Analytics/Grouping variables where each.png)
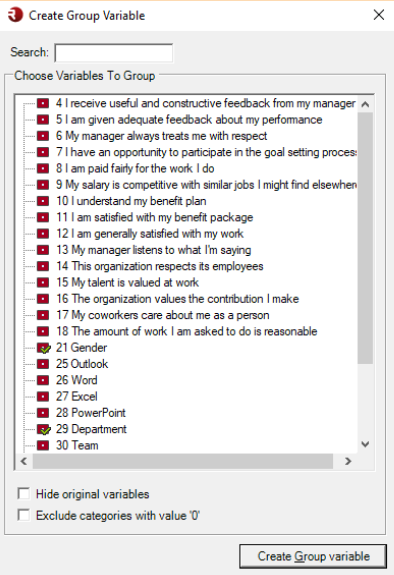
Group 0/1 Variables
If you group variables that contain the values 0 and 1, you can exclude the categories with the value 0.
Example:
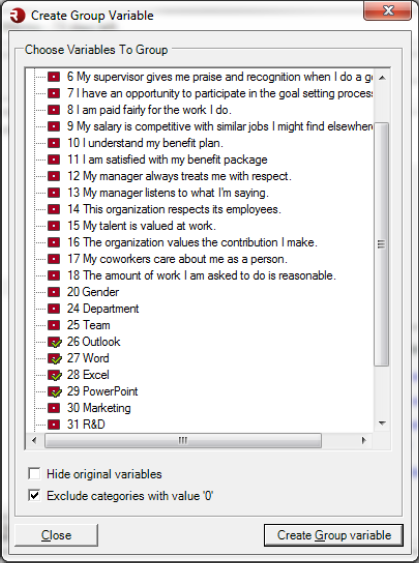
You have four variables for Microsoft Office training courses. The value 1 means the respondent participated, and 0 means the respondent did not participate.
To group these variables:
- Open the variable window.
- Select New Variable > Group Variables.
- Select the course variables.
- Select Exclude categories with the value '0'.
- Click Create Group Variable.
OfficeReports creates a new derived variable like this:
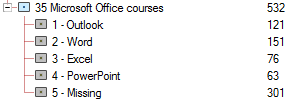
In this result:
- Each variable now contains only the category
1. - OfficeReports replaces the repeated category text with the variable names, such as Outlook, Word, and Excel.
- OfficeReports adds the category Missing, defined by all excluded categories, for example
(Outlook=0 AND Word=0 AND Excel=0 AND PowerPoint=0).
Read more in the video: Video: Grouping 0/1 variables
Create a Variable from a Formula
You can create a new variable based on a formula or expression.
- Select New Variable > Create Variable.
- Create the variable.
- If the variable is categorical, add categories and define formulas for them.
- If the variable is numeric, edit the formula directly.
Use the Formula Editor to create the formulas.
Convert Text into Categories
You can organize open text responses into categories when the coding does not require advanced text analysis.
- Select the text variable.
- Click Create Categories.

A new derived variable appears with a blue icon. It contains one category for each unique text in the original variable.
Note: OfficeReports only uses the first 256 characters to determine whether a text is unique.
After you create categories from text, you can create a simpler categorization by using Categories > Merge Categories.
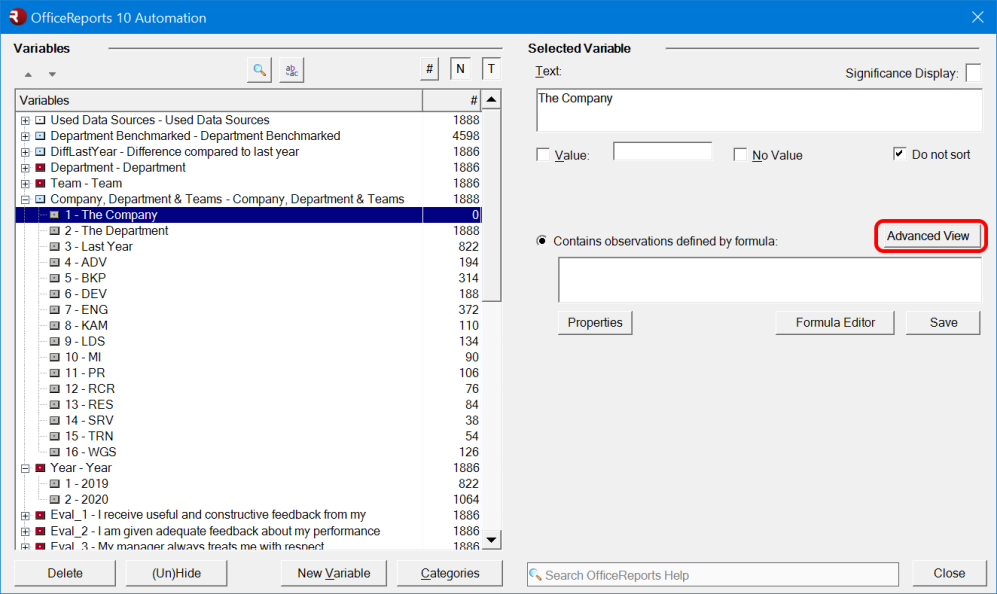
Advanced Category Settings
Use Advanced View to create a banner variable that can contain any data you need. For example, you can add benchmark columns in the banner.
- Select a category in a derived variable.
- Click Advanced View on the right.
See how to use this functionality in the example in the Filtering chapter.
Example
Assume you are creating reports for each team in every department. You want a table that shows all teams in the same department as the selected team. You also want to add columns for the whole company, the whole department, and last year.
The Report Filter is set to category 2020 of the variable Year. You select one department as the Segment1 Filter and one team as the Segment2 Filter.
To do this:
- Copy the Teams variable.
- Add the categories The Company, The Department, and Last Year.
You have defined Year 2020 as the report filter.
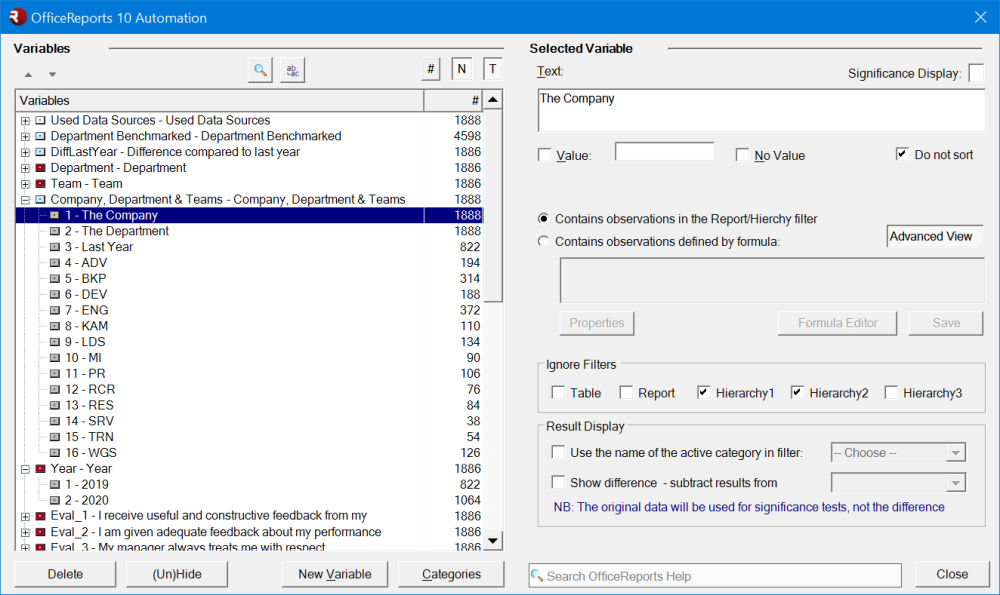
The advanced settings include:
Content
Either observations defined by the report or segment filter, or observations defined by a formula.
Ignore Filters
One or more filters on different levels can be ignored.
Result Display
For automated report production, you can replace a static category name with the category name from a segment filter. For example, if Segment2 is Department and the current report is for H&R, you can display that department name automatically.
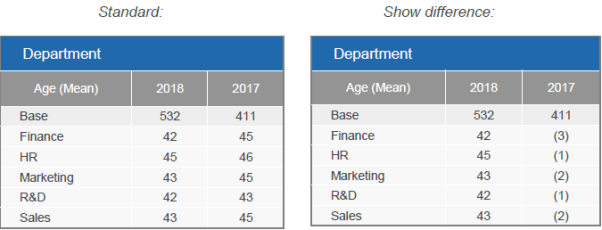
Show Difference
Instead of showing an actual value, you can show the difference compared with another category in the variable. For example, if 2018 shows 58% and 2017 shows 48%, you can display the difference as 10%.
Create Other Variables Like This One
Use Create other variables like this one to apply the same derived-variable setup to other variables. This feature is available for derived categorical variables.
- Create a derived categorical variable.
- Select the derived variable.
- Click Create other variables like this one.
- Select the variables that should use the same setup.
Example: Parent Variable Is Numeric
Assume you have 10 numeric variables with values from 1 to 99. You want to group each variable into two categories: 1 - 49 and 50 - 99.
- Select one numeric variable.
- Use Create Interval Variable to create a derived categorical variable with the two categories.
- Select the new derived variable.
- Click Create other variables like this one.
- Select the other 9 numeric variables.
OfficeReports creates 9 new derived categorical variables with the same category setup.
Example: Parent Variable Is Categorical
Assume you have 15 categorical variables with these categories:
- Strongly Agree
- Agree
- Disagree
- Strongly Disagree
You want to recode each variable into two categories:
- Strongly Agree or Agree
- Disagree or Strongly Disagree
- Select one categorical variable.
- Use Copy Selected Variable.
- Open Categories > Merge Categories.
- Create the two merged categories.
- Select the new derived variable.
- Click Create other variables like this one.
- Select the other 14 categorical variables.
OfficeReports creates the 14 new derived categorical variables with the same recode.
Note: A derived categorical variable is always based on one parent variable. OfficeReports changes only the formulas and formula elements related to that parent variable when you use Create other variables like this one.
This short video introduces some of the options: Creating New Variables