VBA macros
You can use VBA macros to customize tables and charts in OfficeReports. This feature requires OfficeReports Intelligo Premium.
Use VBA macros for tables in Excel
You can customize table content, table layout, or other workbook elements by specifying a VBA macro name in the Table or Chart Layout definition. Each time the table is calculated, OfficeReports runs the macro automatically.
Add your own macros to:
C:\Users\Public\OfficeReports\template\ORXLSMacros.xlam
If your Layout Database is saved in a shared folder, the template files are also saved there.
Your macros must be functions, not subs. They must use the exact same parameters as the macros in the template module, because OfficeReports calls them with that signature. The function must return a string. Return "OK" if the macro runs successfully, or return an error message if it fails.
Example:
Function DemoMacro(curName As Excel. Name, grid As Boolean) As String Dim curTable As Excel. Range Dim curSheet As Excel. Worksheet Dim curWorkbook As Excel. Workbook
On Error GoTo ErrHandler:
Set curTable = curName. RefersToRange Set curSheet = curTable. Worksheet Set curWorkbook = curSheet. Parent
curTable. Cells(1, 1). Value2 = "Demo Macro" curTable. Cells(1, 1). Interior. Color = RGB(255, 0, 0)
curSheet. Cells(1, 1). Value2 = "Demo Macro" curSheet. Cells(1, 1). Interior. Color = RGB(255, 0, 0)
curWorkbook. Worksheets(1). Cells(1, 1). Value2 = "Demo Macro" curWorkbook. Worksheets(1). Cells(1, 1). Interior. Color = RGB(255, 0, 0)
DemoMacro = "OK" Exit Function
ErrHandler: DemoMacro = "DemoMacro Macro Failed: " & Err. Description End Function
To use the macro:
Create a Table Layout in the Table Layout settings. Enter the macro name in the Excel Macro field.
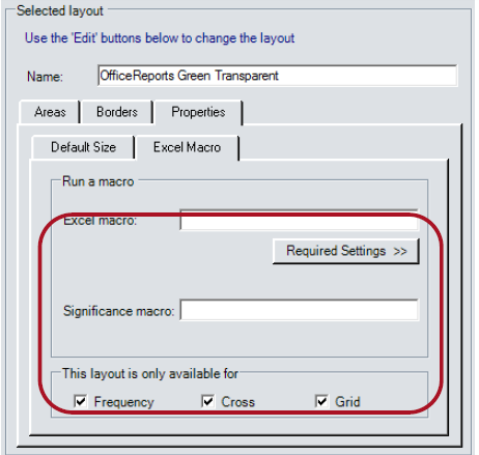
Layout only available for
A specific chart style may only be relevant for frequencies or crosstab charts. Select the context in which a type should be available. Please have a look at the macros in module "template" in the macro file. Your macros need to have the exact same parameters and return a string!

Tables and Charts in PowerPoint
You can customize table content, chart content, layout, or other presentation elements by specifying a VBA macro in the Populate definition. Each time the link is updated, OfficeReports runs the macro.
Add your own macros to:
C:\Users\Public\OfficeReports\template\PPLinkMethods.pptm
After you add your macros, save the file as a PowerPoint add-in:
C:\Users\Public\OfficeReports\template\PPLinkMethods.ppam
Important: If your Table Layout settings are saved in a shared folder, you must also save the template files there.
Important: Your macros must use the exact same parameters as the macros in the template module, and they must return a string.
Example:
Function DemoMacro(curTable As PowerPoint. Table, start_row As Integer, start_col As Integer) As String Dim parentShape As PowerPoint. Shape Dim curSlide As PowerPoint. Slide Dim textBox As PowerPoint. Shape
On Error GoTo ErrHandler:
Set parentShape = curTable. Parent Set curSlide = parentShape. Parent curTable. Cell(1, 1). Shape. TextFrame2. TextRange. Text = "Demo Macro" curTable. Cell(1, 1). Shape. Fill. ForeColor. RGB = RGB(255, 0, 0)
Set textBox = curSlide. Shapes. AddTextbox(msoTextOrientationHorizontal, 10, 10, 100, 40) textBox. TextFrame2. TextRange. Text = "Demo Macro"
DemoMacro = "OK"
Exit Function
ErrHandler: DemoMacro = "DemoMacro Macro Failed: " & Err. Description
End Function
To use the macro:
- Open the Populate definition.
- Add the macro name on the Macro tab.
 \
\