Handle External Crosstabs using Lookup Tables
Use Lookup Tables when you want to report selected content from aggregated data, combine results from different ranges, or sort or transpose an original range.
A Lookup Table contains cells linked to original cells, similar to an Excel formula such as =A1. Unlike a standard Excel link, a Lookup Table also uses the original formatting, font, and fill color. You can also sort a Lookup Table and define pairwise significance comparisons if the original table contains significance information.
Lookup Tables are especially useful when you report aggregated data that contains counts, percentages, and significance information. For example, if a source table contains both counts and percentages, you can use a Lookup Table to create a table that contains only the values you want to report.
To create a Lookup Table, select the rows and columns you need from a source range. OfficeReports automatically includes all cells that belong to both the selected rows and the selected columns.
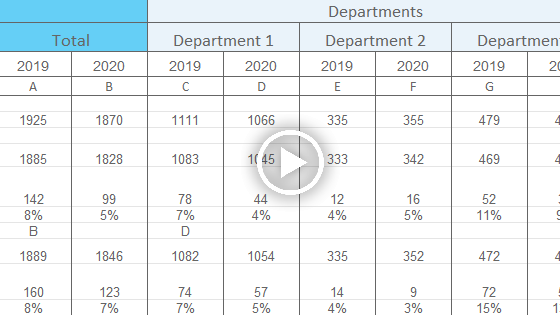
When you report standard crosstabs from other products, you may need to select the count row because it contains the answer alternative text in the stub. OfficeReports combines the correct values from the different rows and creates a table that contains a single row with the answer alternative text, the percentages, and significance shown by fill color.
You can then use the Lookup Table to populate a chart or a table.
Bulk Create Lookup Tables
Instead of creating all Lookup Tables manually, you can create a worksheet that contains flexible Lookup Table definitions.
These definitions are flexible because the data for the next wave does not need to be in the same location. As long as the identifier is unique, OfficeReports can find the original table, update the Lookup Table, and update the presentation. This supports report automation.
For each Lookup Table, OfficeReports needs to know:
- where the table starts by using an identifier
- what the table should contain by using a banner and optionally a stub
You can do this in either of these ways:
- Create a separate workbook with the required definition columns in the first worksheet.
- Select the required parts of the table, right-click, and select Add to Table Definitions.
The second option creates a worksheet named Table Definitions in the current workbook and fills in the required columns.
After you create the table definitions, click Bulk Create to create the Lookup Tables. If you did not create a Table Definitions worksheet, select an Excel workbook that contains the Lookup Table definitions in the first worksheet.
You can define these settings:
- identifier
- banner
- stub
- significance
- row-sort by
- row-sort type
- col-sort by
- col-sort type
- do not sort
- statistics
- format manual
- percent decimals
- number decimals
- destination
Identifier
Use the identifier to uniquely identify a specific table.
OfficeReports finds the table by searching for the identifier text in the first four columns of all worksheets.
Banner
Use the banner to define the table columns.
You can specify the banner in either of these ways:
- as semicolon-separated text that contains the banner categories
- as the name of an Excel Named Range that contains the banner category texts as exact matches
OfficeReports searches for the specified texts from the row where it found the identifier text and up to 10 rows below it.
When OfficeReports finds the banner row, it looks in the next three rows for a row that contains significance characters for each column. All texts in that row must either:
- all have a single character
- all have two characters
- all have a single character in parentheses
- be blank
The Lookup Table contains the banner categories in the order you specify. They do not need to appear in the same order as in the aggregated table.
Important: If your aggregated tables contain multiple variables and a total for each variable, make sure the total appears before the variable categories in the aggregated table.
Stub
Use the stub to define the table rows.
You can specify the stub in either of these ways:
- as semicolon-separated text that contains the stub categories
- as the name of an Excel Named Range that contains the stub category texts as exact matches
OfficeReports searches for the specified texts starting after the banner row, or after the significance row if one was found.
The stub is optional.
If you specify a stub, OfficeReports adds all items it finds until it reaches three empty cells in the column. This marks the end of the table.
You can also define the end of all tables by naming a cell EndOfTable. When OfficeReports reads a cell with text that starts with the text specified in the named range EndOfTable, it treats that as the end of the table.
Statistics
If you do not specify a stub, OfficeReports automatically adds rows such as Total, Base, and Mean to the stub.
Specify Y if you want these rows included in the Lookup Table.
Significance
If your tables contain significance information and OfficeReports can identify a row that defines which character or characters belong to each column, you can define the pairwise test OfficeReports should display in the Lookup Table.
Use one of these values:
firstto compare all columns to the first columnnextto compare each column to the next columnpreviousto compare each column to the previous columnABto compare columns in pairs such as AB, CD, EF, and display the result in the first column of each pairBAto compare columns in pairs such as BA, DC, FE, and display the result in the second column of each pair
You can also use a custom definition by specifying a pairwise list of the columns to compare.
Example:
CB;DC;DE;FE;GF;
In this example, OfficeReports compares each column to the previous column, but does not compare to the first column.
The result appears in the first mentioned column of each pair.
Destination
Use destination to define the worksheet where OfficeReports creates the Lookup Table.
If the worksheet does not exist, OfficeReports creates it.
If multiple tables are added to the same worksheet, OfficeReports adds each new table below the previous one.
It is good practice to place the tables for the same slide on the same worksheet and give the worksheet a name such as Slide6.
Row-Sort By and Col-Sort By
Use Row-Sort By and Col-Sort By to specify the row or column OfficeReports should sort on.
OfficeReports sorts on the row or column where the banner or stub text starts with the specified text.
Row-Sort Type and Col-Sort Type
Use Row-Sort Type and Col-Sort Type to define the sort direction.
Specify:
ascfor ascending sortdescfor descending sort
Percent Decimals and Number Decimals
Use Percent Decimals and Number Decimals when the original table does not show numbers in the format you need for the presentation.
Specify the number of decimals you want to display.