Data Editor
Use the Data Editor to view and edit your data and variables in OfficeReports. The Data Editor contains a Variable View for working with variables and categories, and a Data View for working with observations in the dataset.
- Click Data Editor to open the window.
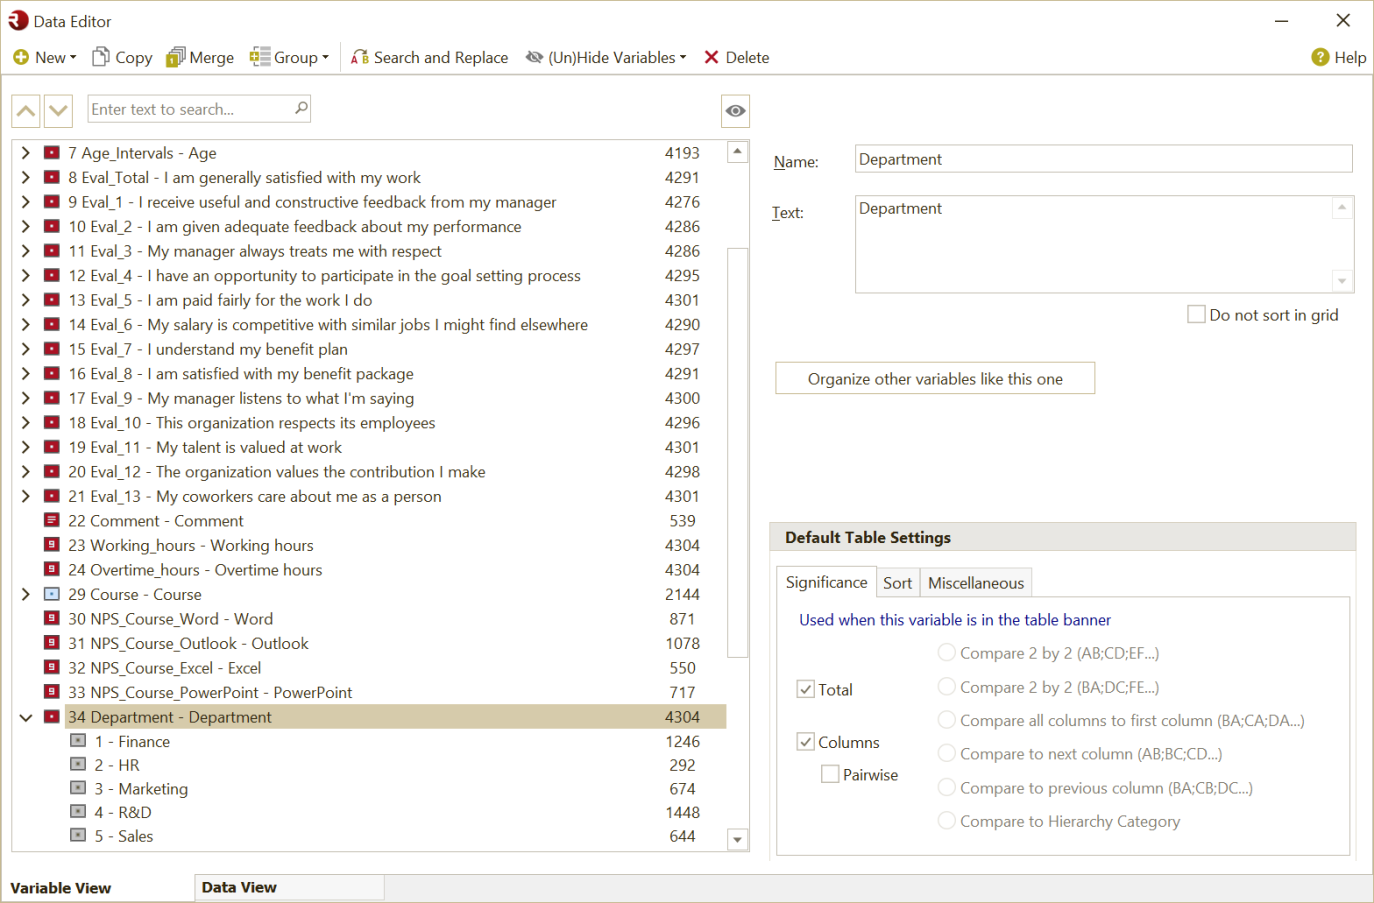
In Variable View, you can review all variables and categories, and edit or recode existing variables and categories. Original variables have a red icon, and recoded variables have a blue icon.
In Data View, you can view and edit all observations in the dataset.
Important: If you plan to import more data into the same workbook later, do not change the variable names. OfficeReports uses these names to match the import file to the current data.
Variables and categories
OfficeReports works with these variable types:
- Categorical Variables 
- Numerical Variables 
- Date Variables 
- Text Variables 
Derived Variables have a blue icon.
- Select a variable or category.
- Edit the available properties on the right side of the window.
You can change properties such as name, text, and other settings.
Note: If you define Default Table Settings for frequently used variables, you can save time when creating tables.
Read more about editing the different variable types in the sections below.
Work with categorical variables
Most tables are built using categorical variables, so OfficeReports includes extensive functionality for this variable type. This is especially useful when you import data from Excel or CSV and need to add missing categories or change the order of categories.
Insert additional categories
- Select the variable where you want to add a category.
- Click Categories.
- Enter a name for the new category.
- Click OK.
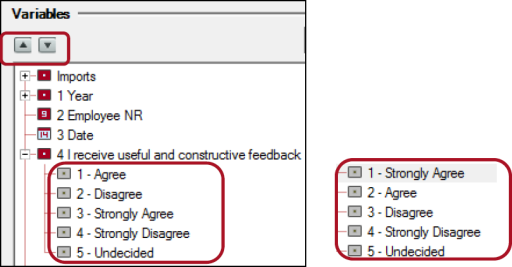
Reorder categories
- Select a category.
- Use the arrow buttons in the upper-left corner of the Variable window to move the category.
You can also use the keyboard shortcuts Ctrl+↑ and Ctrl+↓.
Assign values to categories
In some cases, you may want to assign values to categories so you can calculate results such as mean score and standard deviation. For example, if you use a 4-point scale from Strongly Agree to Strongly Disagree, you can assign a value to each category.

Assign a significance character to a category
When you create tables and charts that show significance letters, OfficeReports assigns letters automatically, such as A for column 1 and B for column 2. You can override this by assigning specific characters to categories in the Variable window.
Use Do not sort for categories
If you select Do not sort for a category, that category keeps its position when categories are sorted in a table or chart. The category is placed after the sorted categories.
Organize other variables like this one
Use this option when multiple variables should contain the same categories in the same order and with the same values.
- Select the variable that already has the correct structure.
- Click Organize other variables like this one.
- In the Select Variables window, select the variables you want to organize.
- Click OK.
The selected variables will then contain the same categories in the same order and with the same values as the selected master variable.
Use Do not sort in grid
When you select a categorical or numerical variable, you can check Do not sort in grid. When you sort variables in a grid table or grid chart, variables with this option selected are excluded from the sorting.
This only works when the variables are placed at the top or bottom of the variable list for the table or chart.
Remove empty categories
This feature is only available for categorical variables that contain at least 20 categories.
Use this feature after adding new data to report templates that contain many categories. It removes all empty categories from the variable in one process.
Sort categories
This feature sorts categories alphabetically.
Note: This feature is only available for categorical variables that contain at least 20 categories.
Work with numerical variables
Examples from a dataset include Age, Working hours, and Overtime hours. You can use numerical variables as numeric summary in table cells.
You can also divide numerical data into intervals or categories. Read more in Recoding Variables.
Work with text variables
Text variables usually contain answers to open-ended questions. You can use text variables in lists, for example to show responses from people who were unhappy with a specific service.
Read more in Verbatim Lists.
You can also divide text variables into categories to make them easier to use. Read more in Recoding Variables.
Work with date variables
OfficeReports imports dates into date variables. You can use date variables in lists and to create derived period variables such as weeks, months, and quarters.
Read more in Recoding Variables.
Recode variables
The top menu bar in Variable View includes recoding functions. You can also select one or more variables in the list and right-click to open a context menu.
- Select one or more variables.
- Use the recoding options from the top menu or right-click menu.
To select multiple variables, use the Shift and Ctrl keys.
Read more about Recoding Variables.
Video: Working with the variables - Introduction
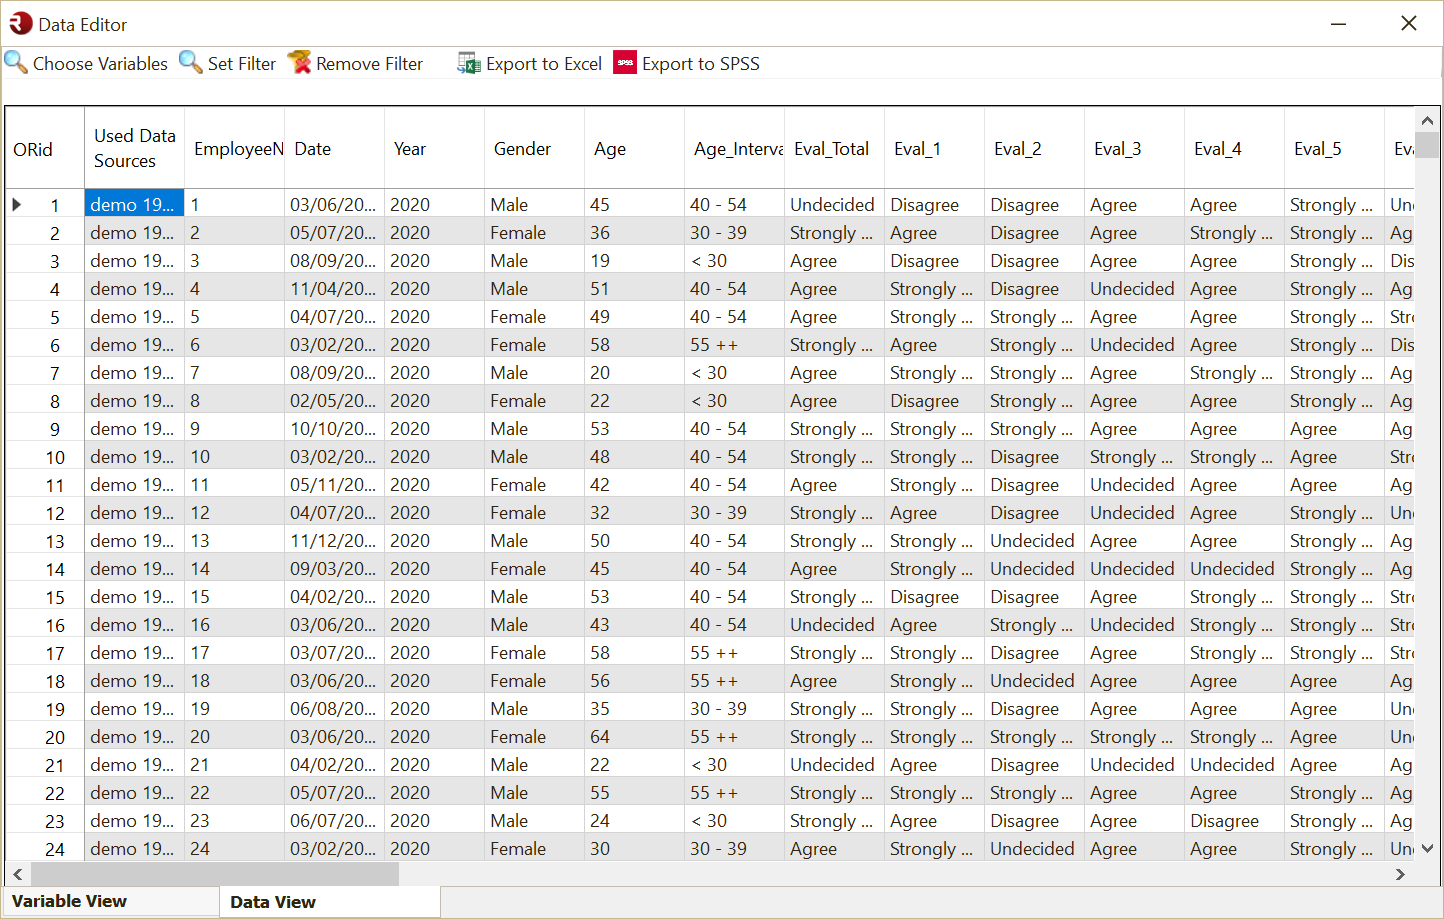
Use Data View
Use Data View to see all answers for each respondent.
- Click Data View.
Note: If you selected multiple variables in Variable View, only those variables are visible in Data View.
Filter the data view
- Click Set Filter.
- Define the filter for the data view.
Edit the data
You can edit all original variables. You cannot edit derived variables because they are based on formulas.
- Select a cell.
- Type the new value.
- Press Enter.
For categories, you can enter the sequence number of the category you want.
When you switch back to Variable View or close the window, OfficeReports asks whether you want to save the changes.
Delete interviews (cases)
- Select one or more complete rows by clicking in the first column (ORid).
- Use Shift or Ctrl to select multiple cases if needed.
- Press Delete on your keyboard.
Video: How to delete a case/interview/record
Export data
You can export the visible data to both Excel and SPSS. This is mainly used when you want to add more information to the export and then import it back into OfficeReports.
The export includes the variable ORid, which you can use as a unique variable when merging the data back into the OfficeReports database.