Explore Data
Use Explore Data to get an overview of your survey results. You can do this by creating summary reports.
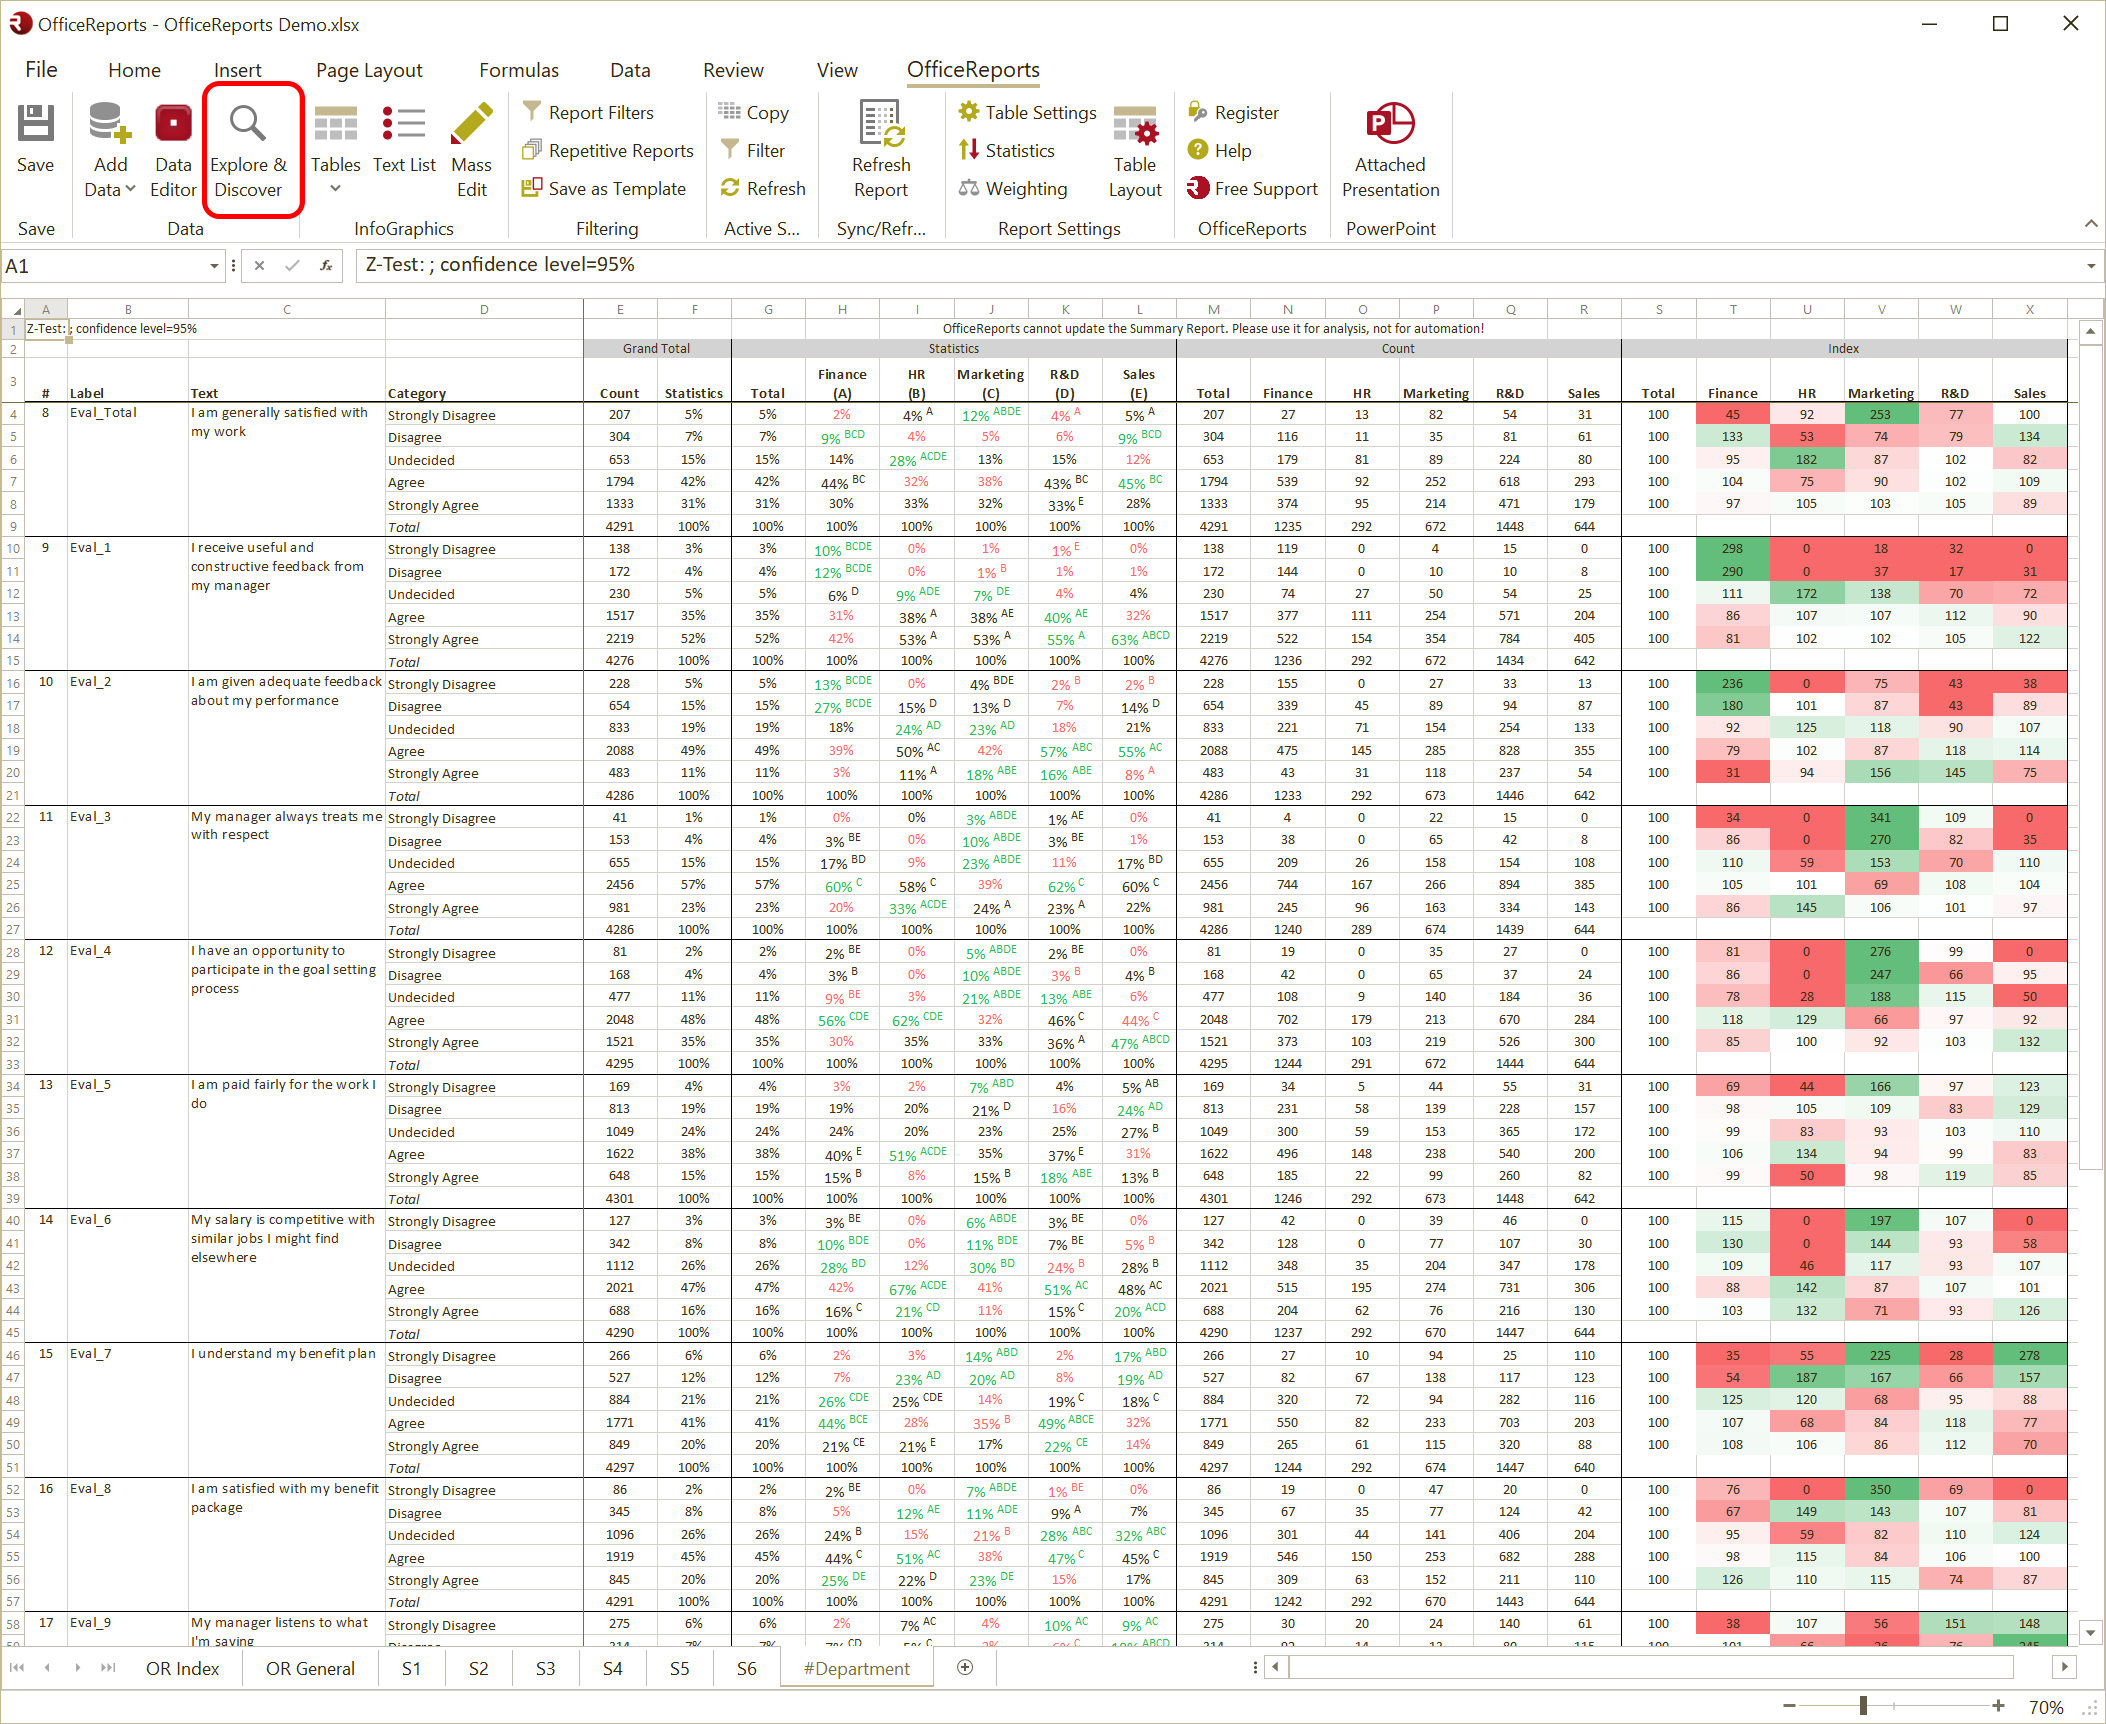
A summary report is a large table that can contain all your variables crossed by a specific banner variable. It includes both a crosstab and an index table for each variable.
Create a Summary Report
- Create a summary report to review your survey results.
- Select the banner variable to cross with your variables.
- Set the Default Table Settings in the Data Editor if you want to calculate significance for specific banner variables.
- Define a filter if you want to apply it to the entire report.
Additional Information
You can use summary reports to review many variables in one place. This helps you quickly explore patterns and results across your survey data.