Creating Tables
You can create tables in the OfficeReports App by dragging variables from the Data Editor and dropping them onto the worksheet.
In Excel or in the OfficeReports App, you can also create a table manually.
- Select an empty cell in the workbook.
- Click Table > Create Table in the OfficeReports ribbon tab, or right-click the empty cell and select Create Table.
Before you create tables, it is useful to understand how OfficeReports handles table layout, default settings, filters, and table types.
Table Layout
OfficeReports creates tables in either the selected PowerPoint layout or the selected Excel layout, depending on the output you need.
If Excel is opened from PowerPoint, OfficeReports also uses the PowerPoint layout in Excel.
To change the default table layout:
- Open the OfficeReports ribbon tab.
- Click Table Layout.
Read more about Table Layout.
Important: Make sure the correct table layout is selected before you create tables.
Default Settings
You can save time by defining the correct default settings before you create tables. OfficeReports then uses these settings automatically.
To define report-level default settings:
- Open the OfficeReports ribbon tab.
- Click Table Settings.
- Define the settings you want, for example a default weight variable.
Some settings are reused often for specific variables, for example when a variable is frequently used in the banner. You can define these defaults in the Data Editor.
To define variable-level default settings:
- Open the Data Editor.
- Select the variable.
- Set the Default Table Settings for that variable.
You can use this to define settings such as sorting and significance testing.
Important: Correct default settings can save a large amount of time when you create many tables.
Apply Weighting
You can specify the weight variable in the Statistics tab. If you did not import a variable with respondent weights, you can let OfficeReports calculate weights
Read more about Weighting.
Important: Respondents without a weight-value or with weight-value 0 are ignored in weighted tables.
Table Filter
In addition to report-level filters, you can define a filter for each table.
You can do this in either of these ways:
- Drag a category or variable from the Data Editor onto the data area of an existing table.
Or:
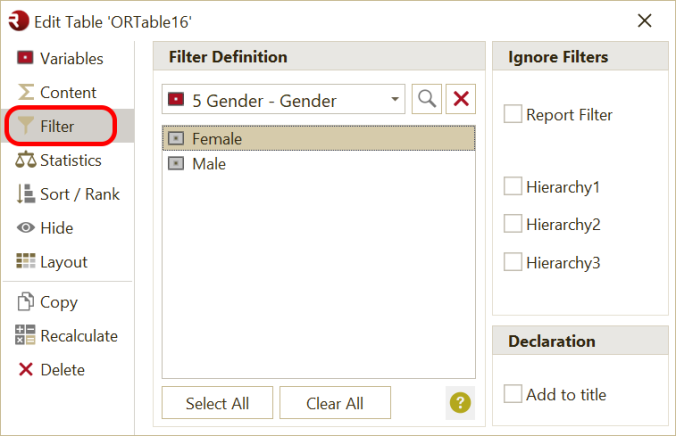
- Open the table definition.
- Select the Filter tab.
- Define or edit the filter.
Filter Based on Multiple Variables
You can create a table filter based on multiple variables.
When you use drag and drop:
- Drag a category from one variable onto the table.
- Drag a category from another variable onto the same table.
OfficeReports then creates the combined filter automatically.
If you need a more advanced filter:
- Create a derived variable.
- Create a category with a formula that includes the categories you need.
- Use the Formula Editor to create the formula.
For example, if you need to filter on combinations of gender and age intervals:
- Merge the two variables in the Data Editor.
- Use the categories from the merged variable as the filter.
Sorting
You can sort both the rows and the columns of the table in the 'Col Sort' and 'Row Sort' tabs. It is possible to sort ascending, descending or in the 'Same Order' as another table or range. For complex sorting not supported natively by OfficeReports, you can do the sorting in Excel and sort the table just like this range.
It is also possible to only show a specific number of categories from the top or the bottom of the table. This way you can e.g. only show the top 10 categories in the table.
In the Data Editor it is possible to define 'Do not sort' on both variables (not sorted in Grid Tables) or categories. This way you can e.g. keep a specific Brand always as the first category, or 'I don't know' as the last category.
Decimals
In the 'Decimals' tab you can overrule the default number of decimals, which is specified in the used Table Layout.
Ranking
Instead of showing e.g. Mean or Percentages, OfficeReports can show the ranking of the categories like e.g. "2 of 5", or just "2". The way the ranking is shown is defined in the Table Settings.
Hide Categories
In the 'Hide' tab, you can select the categories you do not want to see in the table.
It is also possible to define an Excel range and name it 'COMPSET'. Check "not in range 'CompSet'" to hide all categories that are not shown in the range. Use the COMPSET range e.g. when you want to report specific brands for specific countries. Using Excel formulas you should be able to fill the range named COMPSET with the correct brands for a specific country.
Table Types
OfficeReports supports these table types:
- Frequency tables and cross tables (crosstabs), used to report one variable, optionally split by banner variables
- Grid tables, used to report multiple variables in the same table, optionally split by a banner variable
- Aggregate tables, used to report questions asked multiple times
- Performance tables, used to report worst and best performance
Edit Tables
After you create a table, OfficeReports opens the editing interface:
- In Excel, OfficeReports shows the Table Pane
- In the OfficeReports App, OfficeReports shows the Edit Table window
You can then adjust the table settings.
Read more about editing tables here.
To edit an existing table in the OfficeReports App:
- Double-click the table.
To edit an existing table in Excel:
- Click inside the table.
OfficeReports then opens the relevant editing interface.