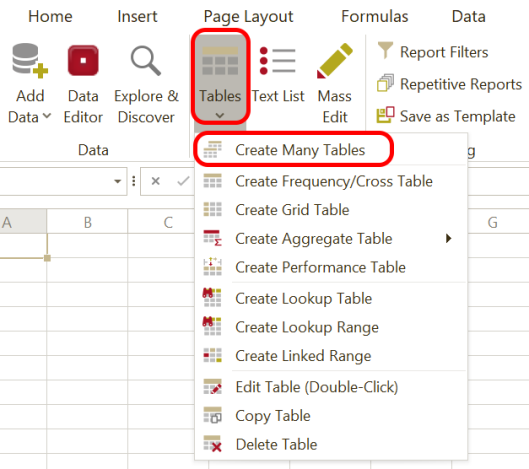
Bulk Create Tables
Use Bulk Create Tables to create many crosstabs in one process.
Instead of creating tables one by one, OfficeReports can generate a table for each selected variable combined with each selected banner variable.
This is useful when you want to:
- create a full set of standard crosstabs quickly
- apply the same report settings to many tables
- combine variable-level defaults with report-level defaults
- generate analysis tables in a consistent structure
Before you start
Before creating many tables, it is important to understand which existing settings OfficeReports will use automatically.
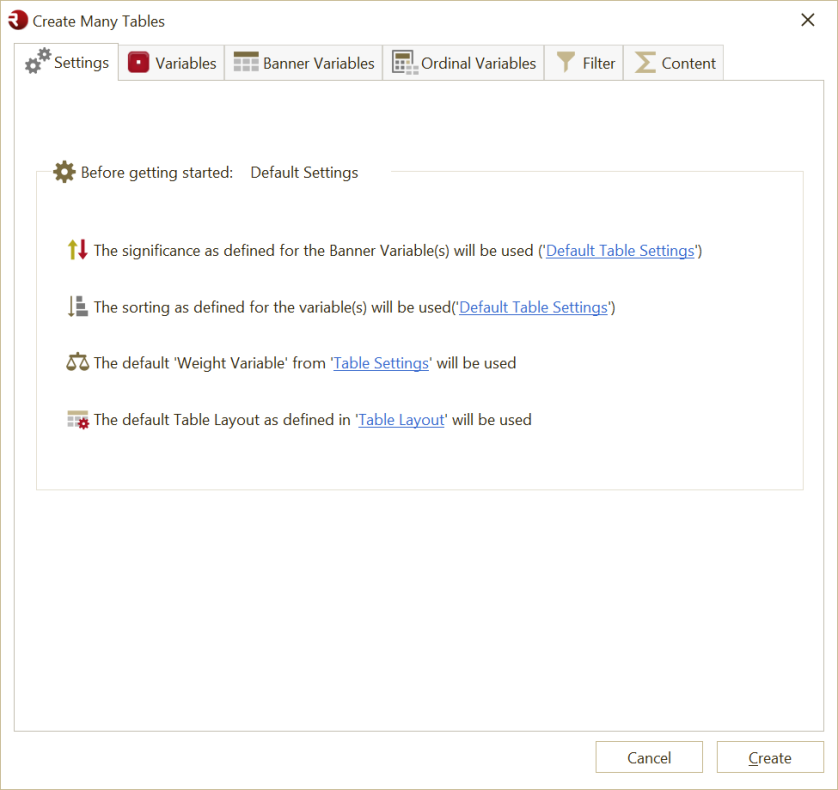
The Settings tab shows the defaults that will be used when the tables are created:
- the significance settings defined for the selected Banner Variable(s) through Default Table Settings
- the sorting defined for the selected variable(s) through Default Table Settings
- the default Weight Variable from Table Settings
- the default Table Layout from Table Layout
This means Bulk Create Tables does not start from zero. It uses the report-level and variable-level defaults that are already defined.
Settings tab
Use the Settings tab to review the default settings that will be applied during bulk creation.
This tab is mainly a reminder of which defaults OfficeReports will use.
Before creating many tables, it is often useful to review:
Variables tab
Use the Variables tab to select the variables for which tables should be created.
These variables become the main table rows or cell contents.
OfficeReports generates a table for each selected variable combined with each selected banner variable.
For example, if you select:
- 20 variables
- 2 banner variables
OfficeReports creates tables for all combinations of those selections.
Use this tab to:
- add variables
- remove variables
- change the order of variables
- clear the current selection
Create all tables in the same worksheet
Select Create all tables in the same Worksheet if you want all generated tables to be placed in one worksheet.
This is useful when:
- you want one long analysis sheet
- you want to review all tables together
- you want to export or compare many tables in one place
If this option is not used, OfficeReports will create each table in a new worksheet.
Banner Variables tab
Use the Banner Variables tab to select the banner variables for the generated tables.
Banner variables become the table columns.
Use this tab to:
- add banner variables
- remove banner variables
- change their order
- clear the selection
Show all Banner variables in same table
Select Show all Banner variables in same table if you want multiple banner variables to appear together in one table instead of creating separate tables per banner variable.
This is useful when:
- you want a wider table with several banner variables
- you want to compare several banner structures in one table
- you want a compact output with fewer separate tables
Last variable 'nested'
Use Last variable 'nested' when the last selected banner variable should be nested under the previous banner variable.
This is useful for multi-level banner structures.
Ordinal Variables tab
Use the Ordinal Variables tab to identify which of the selected variables should be treated as ordinal variables.
For those variables, OfficeReports can automatically add statistics that are relevant for ordinal scales.
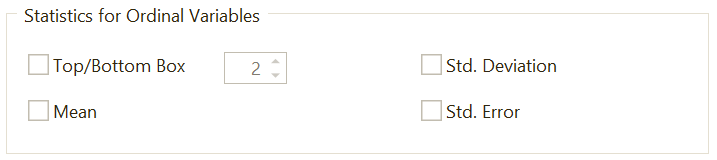
Statistics for Ordinal Variables
For the selected ordinal variables, you can choose statistics such as:
- Top/Bottom Box
- Mean
- Std. Deviation
- Std. Error
Top/Bottom Box
Select Top/Bottom Box when OfficeReports should calculate a Top Box and Bottom Box result for ordinal variables.
You can also define how many categories should be included, for example:
- Top 2 / Bottom 2
- Top 3 / Bottom 3
Use this for rating scales where grouped positive and negative results are important.
Mean
Select Mean when the average scale value should be added for ordinal variables.
This is useful for:
- agreement scales
- satisfaction scales
- rating questions with a meaningful order
Std. Deviation
Select Std. Deviation when you want OfficeReports to show the standard deviation for ordinal variables.
This is useful when you want to show the spread of the results.
Std. Error
Select Std. Error when you want OfficeReports to show the standard error for ordinal variables.
This is useful when the analysis requires more statistical detail.
Filter tab
Use the Filter tab to apply a filter to the tables that will be created.
This lets you limit the generated tables to a selected part of the data.
You can:
- choose a filter variable
- select one or more categories
- create tables only for the filtered respondents
Use this when:
- you want to generate tables only for one wave
- you want to generate tables for one market, department, or segment
Content tab
Use the Content tab to define which values and statistics should be shown in the generated tables.
Cell Values
You can choose to show:
- Observations
- Percentage
Use this to define what the table cells should contain.
For example:
- observation counts only
- percentages only
- both counts and percentages
Do not show
Select 0-values if zero values should be hidden in the generated tables.
This can make tables easier to read when many cells contain zero.
Column Statistics
You can add column statistics such as:
- Total
- Base
- Chi Square
Use these when the generated tables should include summary information for the columns.
Row Statistics
You can add row statistics such as:
- Grand Total
- Total
- Mean
- Base
Use these when the generated tables should include summary information for the rows.
How Bulk Create Tables uses existing defaults
Bulk Create Tables works best when your report defaults are already configured.
OfficeReports can automatically use:
- significance settings from the selected banner variable(s)
- sorting settings from the selected variables
- the default weight variable from Table Settings
- the default layout from Table Layout
This makes it possible to create many tables in one step while still following the same report standards.
Typical workflow
A common workflow is:
- Define the default weight variable in Table Settings
- Define sorting and significance defaults in Default Table Settings
- Define the default table layout in Table Layout
- Open Bulk Create Tables
- Select the variables
- Select the banner variable or variables
- Select ordinal variables if needed
- Apply a filter if needed
- Define the content to show
- Click Create
When should I use Bulk Create Tables?
Use Bulk Create Tables when:
- you need many standard crosstabs quickly
- the same structure should be used across many variables
- you want to reuse report-level and variable-level defaults
- you want a consistent table set for analysis or reporting