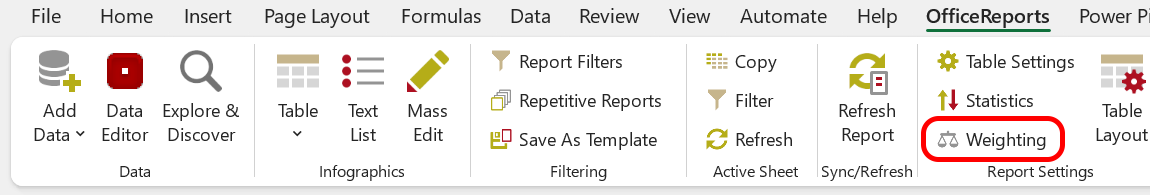
Weighting
Use weighting to correct disproportional sample sizes and adjust the collected data so it better represents the population from which the sample was drawn.
For example, your sample may contain 65% males while the population contains 55% males. In that case, the sample is not representative because the frequency distribution in the sample does not match the population.
OfficeReports can use weights for all cases to adjust this distortion in table and chart calculations. If the weights are not imported as a numeric variable, OfficeReports can calculate a weight variable by using RIM weighting across multiple dimensions.
Calculate Case Weights
Use the Calculate Weights window to create a weight variable.
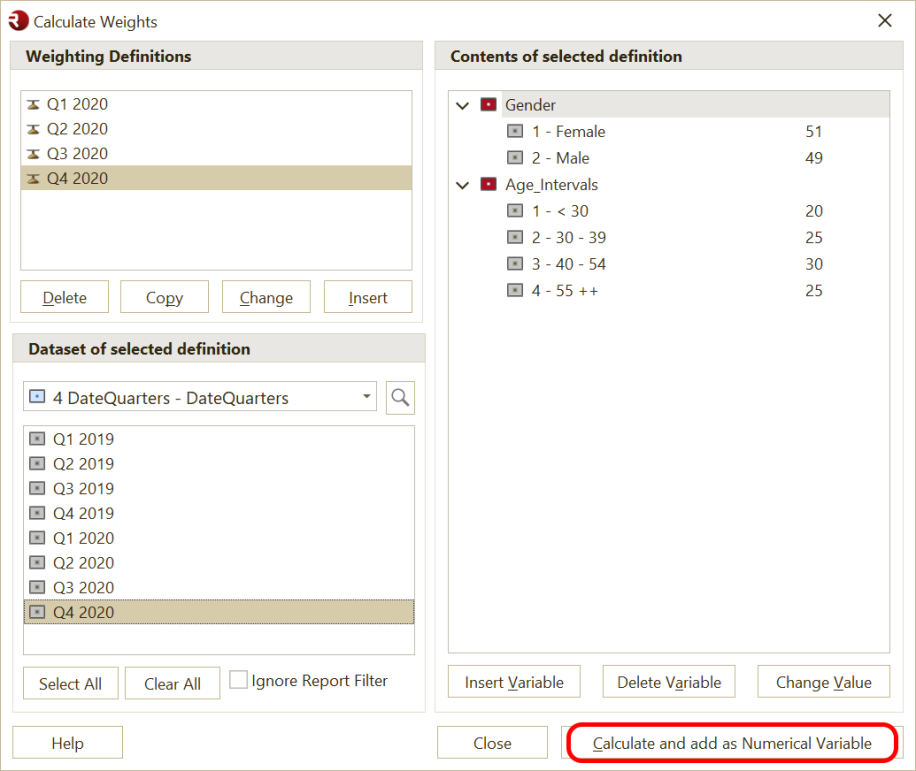
- Click Insert.
- Enter a name for the weight definition.
- Add the variables you want to use for weighting, for example gender and age.
- Assign the correct values to the categories.
- Specify the sample you want to weight, for example
Q1 2020. - Click Calculate and add as Numeric Variable.
OfficeReports creates a new numeric variable in the Data Editor that contains the calculated weight for each respondent.
Combine Weight Variables
If you have multiple numeric weight variables, you can combine them into one variable.
- Select the weight variables in the Data Editor.
- Right-click the selected variables.
- Select Create SUM variable.
- Use the new variable as the Weight Variable for your tables (Statistics > Apply Weighting).
Default Weight Variable
If you want to apply weighting to all tables in a report, set a numeric variable as the default weight variable.
- Open Table Settings.
- Select the numeric variable you want to use as the Default Weight Variable.
- When closing the dialog, OfficeReports will ask you if you want to use this weight variable for all the tables you already have created.
OfficeReports then uses this variable by default for the new tables you create in the report.
Important: Respondents without a weight-value or with weight-value 0 are ignored in weighted tables.