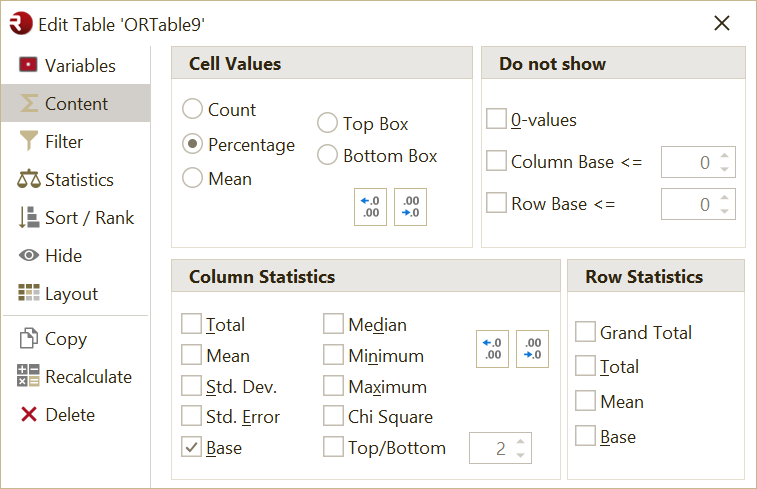
Edit a Table
Use the Edit Table window in the PowerPoint and the OfficeReports App or the Table Pane in Excel to change the settings for an existing table.
- In the OfficeReports App, double-click a cell in the table.
- In Excel, click a cell in the table.
OfficeReports opens the Edit Table window or the Table Pane, where you can change all table settings.
Filter
Use the Filter tab to define a table filter. The categories you select are included in the data used for the table.
For example, if you select Finance, HR, and Marketing, OfficeReports excludes the categories that are not selected.
If you need a filter based on multiple variables, first create a derived variable. The derived variable must contain a category with the data you want to use in the filter.
For information about filtering entire reports, see Report Filter.
You can use any combination of categories from a categorical variable as a filter, including categories from a derived variable.
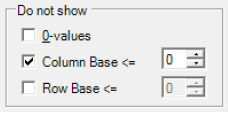
If a table contains a category that is filtered out, the category name is still shown, but the number of observations or responses is 0. To hide a filtered-out category from the table, select Do not show in the Options box.
Ignoring Filters
Use Ignoring Filters to exclude selected filters when OfficeReports calculates the table. This is useful for report automation, for example when batch generating reports.
Add a Filter Declaration
To add the filter declaration to the table title, select Add to title in the Filter tab.
You can also use the Filter tab to ignore the Report Filter or any of the Segment Filters.
For example, when you create reports for each department, you may want one table to show results for the whole company. In that case, you can ignore the department filter, whether it is defined as the report filter or as a segment filter.
Statistics
Use the Statistics tab to define Z-test and T-test settings for tables.
Read more about Significance Testing.
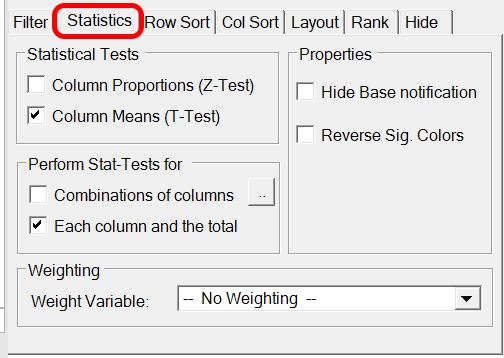
Column Proportions (Z-Test)
Use Column Proportions (Z-Test) to compare column proportions row by row.
This test checks whether the proportion in one column is significantly different from the proportion in another column.
OfficeReports calculates the proportion as the cell count divided by the column base.
Column Means (T-Test)
Use Column Means (T-Test) to compare column means in a table row.
This test checks whether the mean in one column is significantly different from the mean in another column.
Apply tests to
Column combinations
Use Column combinations to define which columns should be tested against which other columns.
Click the ... button to open the Column combinations to test dialog.
You can define:
- standard column combinations, such as
ABCD;EFG - pairwise column combinations, such as
AB,BA,next,previous, or a custom pairwise definition
In a pairwise comparison, OfficeReports visualizes significant differences by using fill colors or font colors instead of significance characters.
Each column vs. total
Use Each column vs. total when you want OfficeReports to test each column against the Total column.
Properties
Hide low base marker
Use Hide low base marker when you do not want to show the low-base marker in this table.
Invert sig. colors
Use Invert sig. colors to reverse the colors used to show significant differences.
The significance colors themselves are defined in the table layout.
Weighting
To use weighted data, specify a Weight Variable. This can be:
- a numeric variable you imported
- a numeric weight variable calculated by OfficeReports
For information about calculated weights, see Weighting Data.
If you need to weight all or most tables, set a default weight variable in Table Settings.
Sorting
OfficeReports can sort rows and columns in ascending order, descending order, or in the same order as another table. You can also use any Excel Named Range for this.
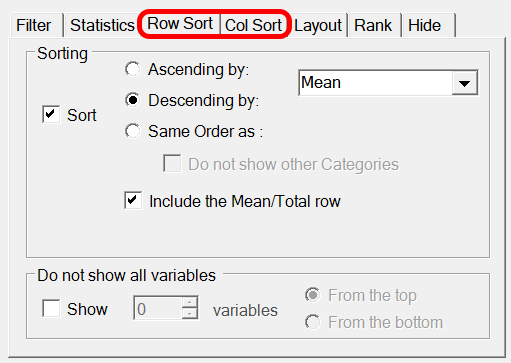
If you use a Reporting Table Layout, you can also sort Mean or Total together with the categories.
Layout
Use the Layout tab to control the layout and text display of an existing table.
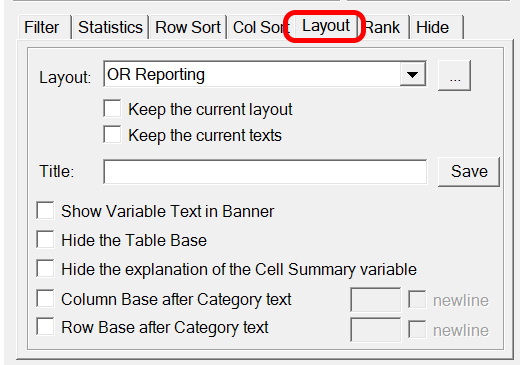
By default, OfficeReports uses the layout defined in Layout Settings. You can override this for an individual table by selecting a different layout in the Layout list.
Layout
Use Layout to select the table layout you want to use for this table.
Keep the current layout
Use Keep the current layout to keep the current table formatting when the table is recalculated or updated.
When this option is selected, OfficeReports does not reapply the selected layout definition. This makes it possible to format the table manually and keep that formatting.
Keep the current texts
Use Keep the current texts to keep the current table texts when the table is recalculated or updated.
When this option is selected, OfficeReports does not rewrite the table texts. This makes it possible to change the texts manually and keep those changes.
Show Variable Text in Banner
Use Show Variable Text in Banner to show the variable text in the banner above the table.
Hide the 'Table Base'
Use Hide the 'Table Base' to hide the Table Base row.
Column Base after Category text
Use Column Base after Category text to show the column base together with the category text instead of in a separate base row.
You can also define the text format, for example (n=#), and choose whether the base should be shown on a new line.
Row Base after Category text
Use Row Base after Category text to show the row base together with the category text instead of in a separate base column or row.
You can also define the text format, for example (n=#), and choose whether the base should be shown on a new line.
Hide the Explanation of the Cell Summary Variable
For tables that contain summary statistics in the cells, OfficeReports adds this information to the title by default.
Clear this option if you do not want to show that explanation.
Ranking
Use Ranking to show the rank of each category compared to the other categories in the table.
This feature works for frequency tables, cross tables, and grid tables. It works with percentages, observations, and numeric values in cells.
You can display the ranking by row or by column, and sort it in ascending or descending order.
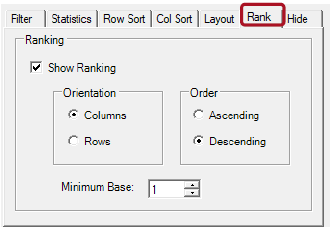
You can also choose to show the ranking only for categories with a minimum base of observations.
For example, you can use ranking to show which department performs best on different dimensions. The ranking can be based on mean values or on statistics such as Top 2.
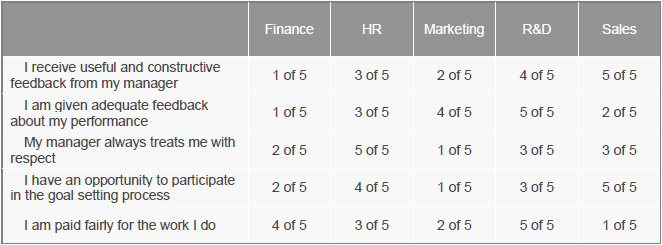
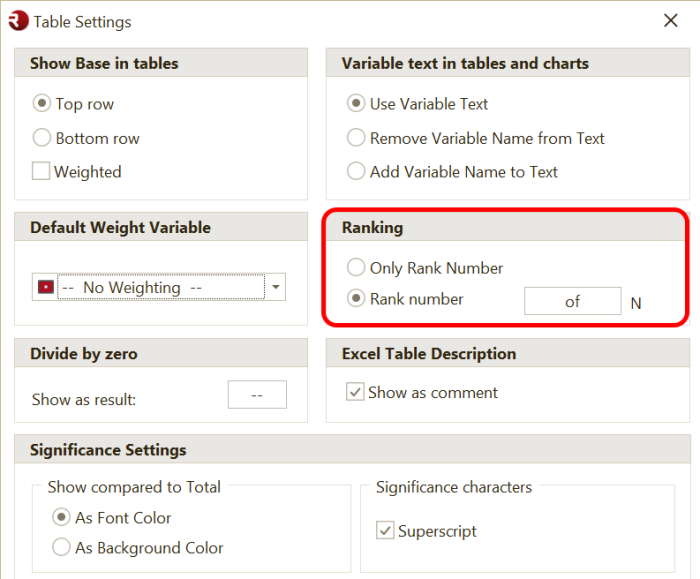
By default, the table shows ranking as 1 of 5. If you prefer 1 out of 5, change this in Table Settings. You can also choose to show only the rank number.
Hide
Use Hide to hide selected categories without changing the calculation results.
Unlike Filter, Hide does not affect the underlying calculations.
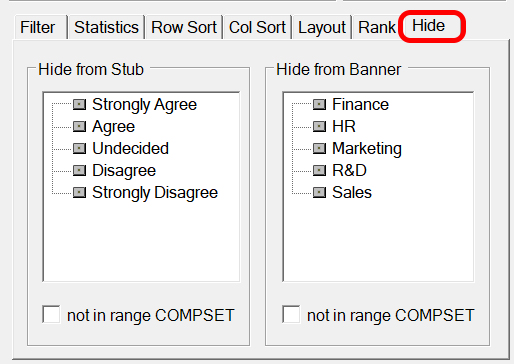
not in range COMPSET
Use not in range COMPSET to hide brands that are not part of a defined competitor set.
To use this feature:
- Select a range in Excel.
- Right-click the range.
- Select Name.
- Name the range
COMPSET. - Make sure the range contains all brands needed for the specific country report.
- Select not in range COMPSET.
OfficeReports then hides all brands that are not listed in the COMPSET range.