Edit Table Layout - Properties
Use Edit Table Layout - Properties to define the general properties of a table layout.
These properties control the overall structure and behavior of the layout, such as:
- default row heights and column widths
- whether the layout is meant for analysis in Excel or for PowerPoint population
- how summary rows and percentages are displayed
- how significance colors behave
- how compact or separated the table should be
When you select a table layout, OfficeReports shows a sample table based on example data in the preview pane. This makes it easier to see how the selected settings affect the final crosstab or reporting layout. 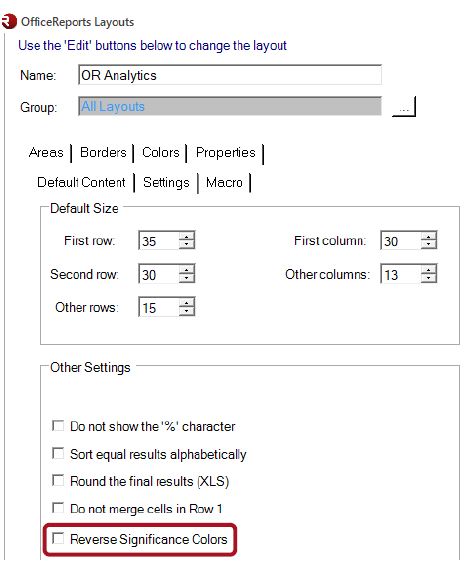
Default Size
Use Default size to define the default row height and column width in the table layout.
Other Settings
Use Other Settings to control how OfficeReports arranges and displays table content beyond the basic row heights and column widths.
These settings are especially important when you want to use different layouts for:
- detailed analysis in Excel
- compact reporting and PowerPoint population
Populate Layout (for PowerPoint)
Use Populate Layout (for PowerPoint) for table layouts that are meant to populate tables, charts, and shapes in PowerPoint.
A layout with Populate Layout selected is different from a standard analytics crosstab layout.
A standard analytics layout is designed for reading and analyzing the crosstab in Excel. It typically shows multiple values in the same table, such as counts, percentages, and significance characters.
A populate layout is designed specifically for data visualization in PowerPoint. These layouts are intended to produce clean Excel ranges that can be linked to PowerPoint tables, charts, and shapes.
A populate layout typically:
- separates table statistics such as Base, Total, and Mean from the main table body
- shows only one main value type at a time, such as count, percentage, Top 2, or Mean
- uses significance colors instead of significance characters
- makes it easier to select a range that contains exactly the data needed for PowerPoint
This is especially useful when working with Color-Driven Icons, where significance colors in Excel can be translated into arrows or other visual indicators in PowerPoint.
Use Populate Layout when:
- the table is used as a source for PowerPoint population
- you want a compact reporting layout instead of a full analytics crosstab
- you need a clean range containing exactly the values you want to visualize
- significance should be shown by color instead of significance characters
Compact: Significance next to %
Use Compact: Significance next to % when you want significance to be shown directly next to the percentage in a compact layout.
This makes it easier to keep the table narrow while still showing significance information close to the result it belongs to.
Use this option when:
- space is limited
- the layout is meant to stay compact
- you still want significance information to remain easy to read
Display 'Total'/'Mean' in the first column
Select Display 'Total'/'Mean' in the first column when you want summary rows such as Total and Mean to be labeled in the first column instead of in the last column.
Do not show the '%' character
Select Do not show the '%' character when percentages should be displayed without the percent sign.
This is useful when:
- the table is used for compact reporting
- the values are clearly percentages from the context
- removing the
%character improves readability or saves space
This option is often useful in PowerPoint-oriented layouts.
Sort equal results alphabetically
Select Sort equal results alphabetically when categories with the same value should be sorted alphabetically instead of keeping their original order.
Use this option when:
- ranked results should appear in a stable, predictable order
- you want equal values to be sorted consistently
- the original category order is less important than a clean ranking output
Round the final results (XLS)
Select Round the final results (XLS) when the final values written to Excel should be rounded so that the stored value matches the displayed value.
Without this setting, bar- and column charts in PowerPoint might show a bar/column with the same label (e.g. 2.6), but still have a slightly different height or width.
Use this option when:
- the final Excel value should match what the user sees visually in charts
- exported values
Do not merge cells in Row 1
Select Do not merge cells in Row 1 when the first row should keep separate cells instead of merged header cells.
Use this option when:
- the table should be easier to edit manually in Excel
- merged cells would make copying or selecting ranges less practical
- the layout is intended for downstream use where merged cells are inconvenient
Invert Significance Colors
Select Invert Significance Colors when the meaning of higher and lower significance colors should be reversed.
By default, a significantly higher value is often shown with the positive significance color. For some measures, however, a higher value represents a worse result.
In that case, use Invert Significance Colors so that the color meaning matches the interpretation of the data.
This is especially useful for variables where:
- a higher score is negative
- a lower score is positive
- the default significance colors would otherwise be misleading
Separate Banner Variables with Empty Columns
Select Separate Banner Variables with Empty Columns when banner variables should be visually separated by empty columns.
This can make the result easier to read when:
- multiple banner variables are shown
- the banner becomes wide or complex
- you want clearer visual grouping in Excel
- The results is shown in a bar- or column chart
Use this option when readability is more important than compact width.