Edit Table Layout - Areas
Use Edit Table Layout - Areas to define the formatting for text areas and value areas in a table layout.
When you select a table layout, OfficeReports shows a sample table based on example data to the right of the OfficeReports Layout pane.
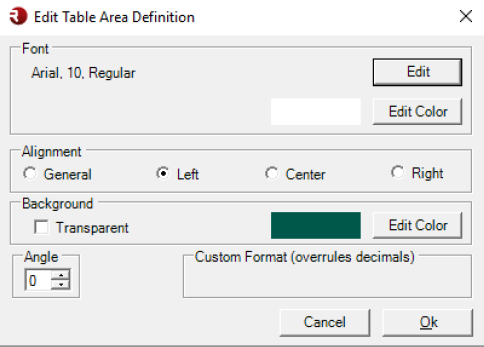
Text Areas
You can define formatting for these text areas:
- Row 1
- Row 2 for cross tables only
- Column 1
Value Areas
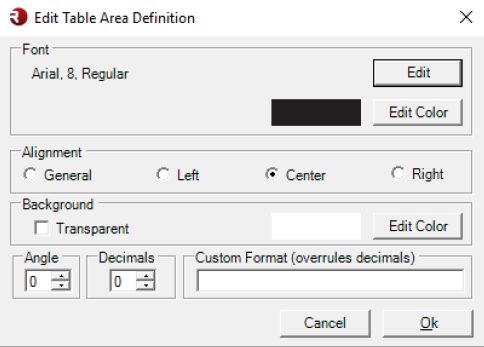
You can define formatting for these value areas:
- Count
- Percentage
- Base
- Total
- Mean
- Std. Deviation

For value areas, you can define:
- font, including size and style
- font color
- alignment
- fill color
- angle
- decimals
- custom format
When OfficeReports adds characters to show low base, insufficient base, or significance, it places those characters based on the alignment:
- to the right of the number when you use Center or Left alignment
- to the left of the number when you use Right alignment
Custom Format
Use Custom Format when you want to control how numbers are displayed.
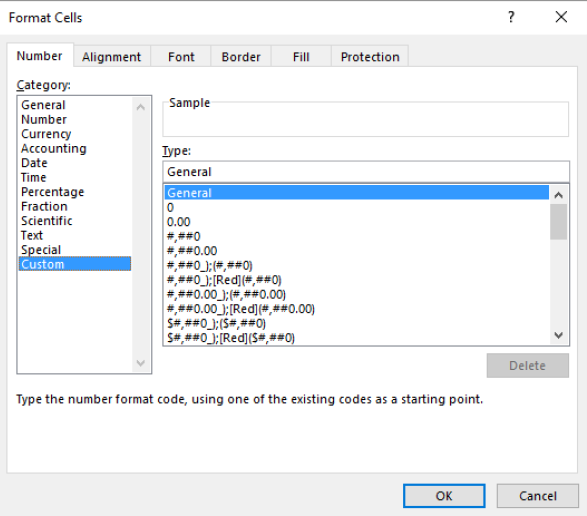
For example, you can define a format where:
- numbers always include a
$ - percentages do not include a percent sign
You can use the same custom number format settings that are available in Excel.